golang pprof
- 定义:pprof,golang程序性能分析工具。
- 使用:
- 相关包:
- runtime/pprof:采集程序(非 Server)的运行数据进行分析
- net/http/pprof:采集 HTTP Server 的运行时数据进行分析
- 相关包:
- 一次使用过程:
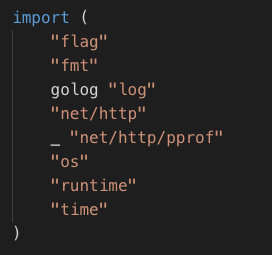
- 首先在api server中import pprof包并配置对外暴露的端口:

- 然后server服务起来后,go tool pprof http://host:pprof_port/debug/pprof/heap?seconds=60 ,拉取程序一分钟内存使用情况,heap可配置其他参数如profile(cpu)等,seconds可更改为其他时间。(前提是先安装pprof, go get -u github.com/google/pprof)
- 拉取下来的文件,like this:

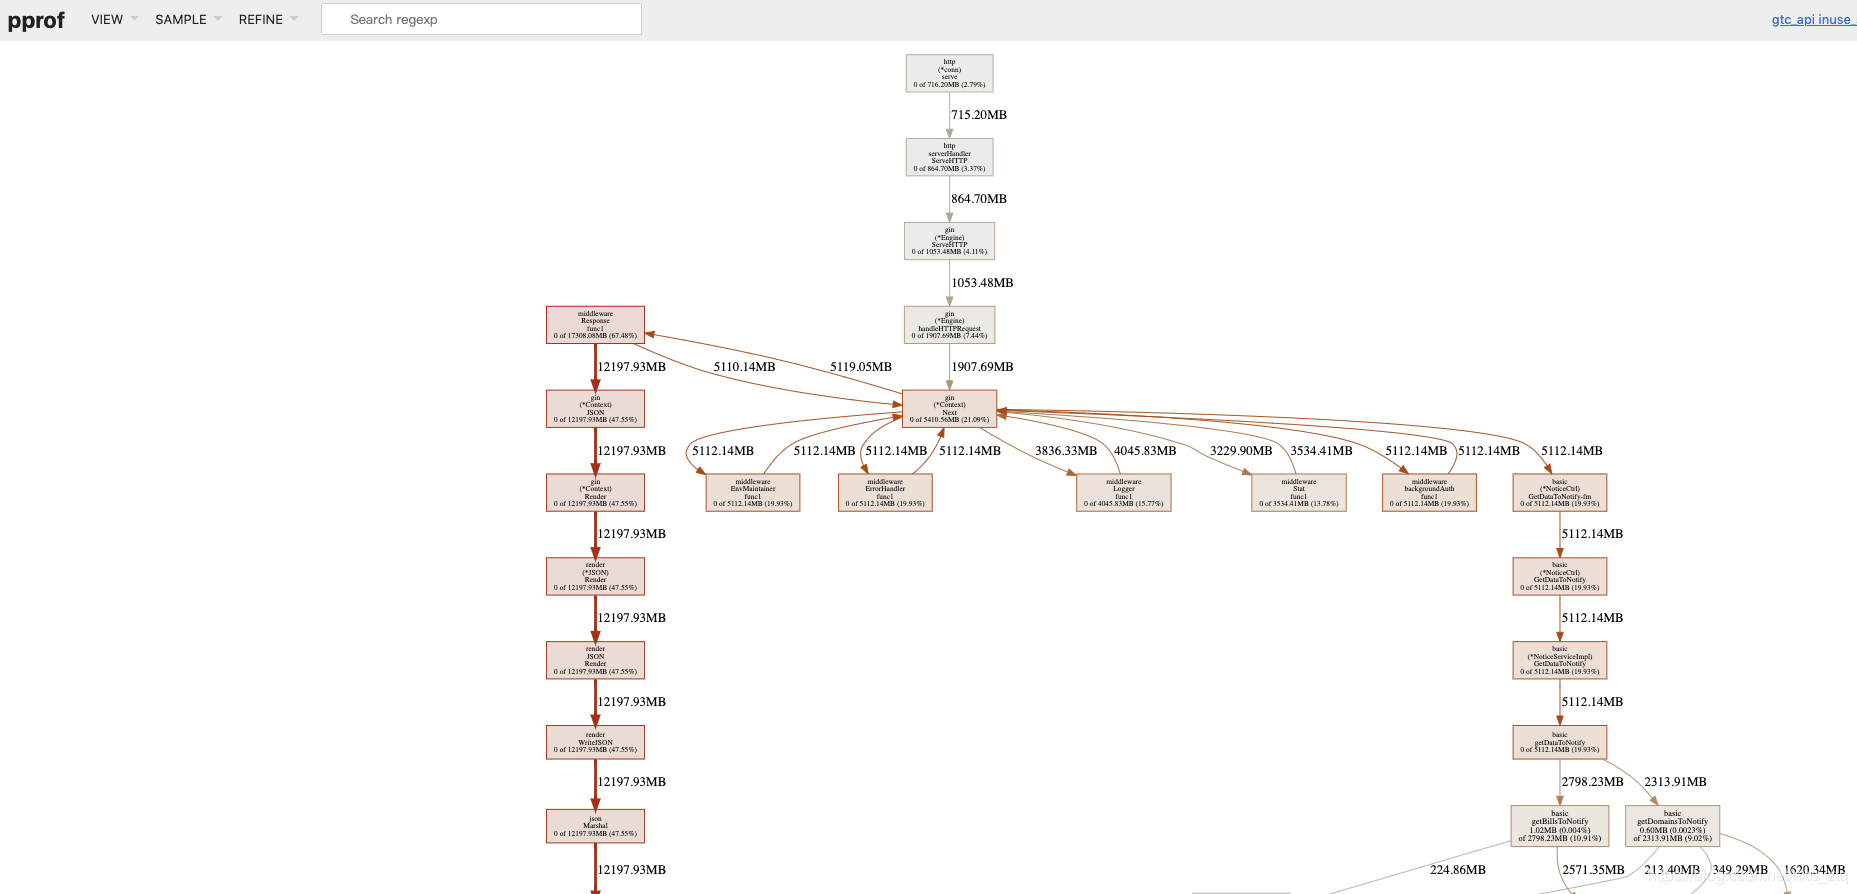
分别对应内存数据和cpu数据。 - 然后使用pprof对数据进行分析,go tool pprof -http=:port ./文件名,会把对应文件的数据在本地相应端口以http形式展示,即可在浏览器中打开:
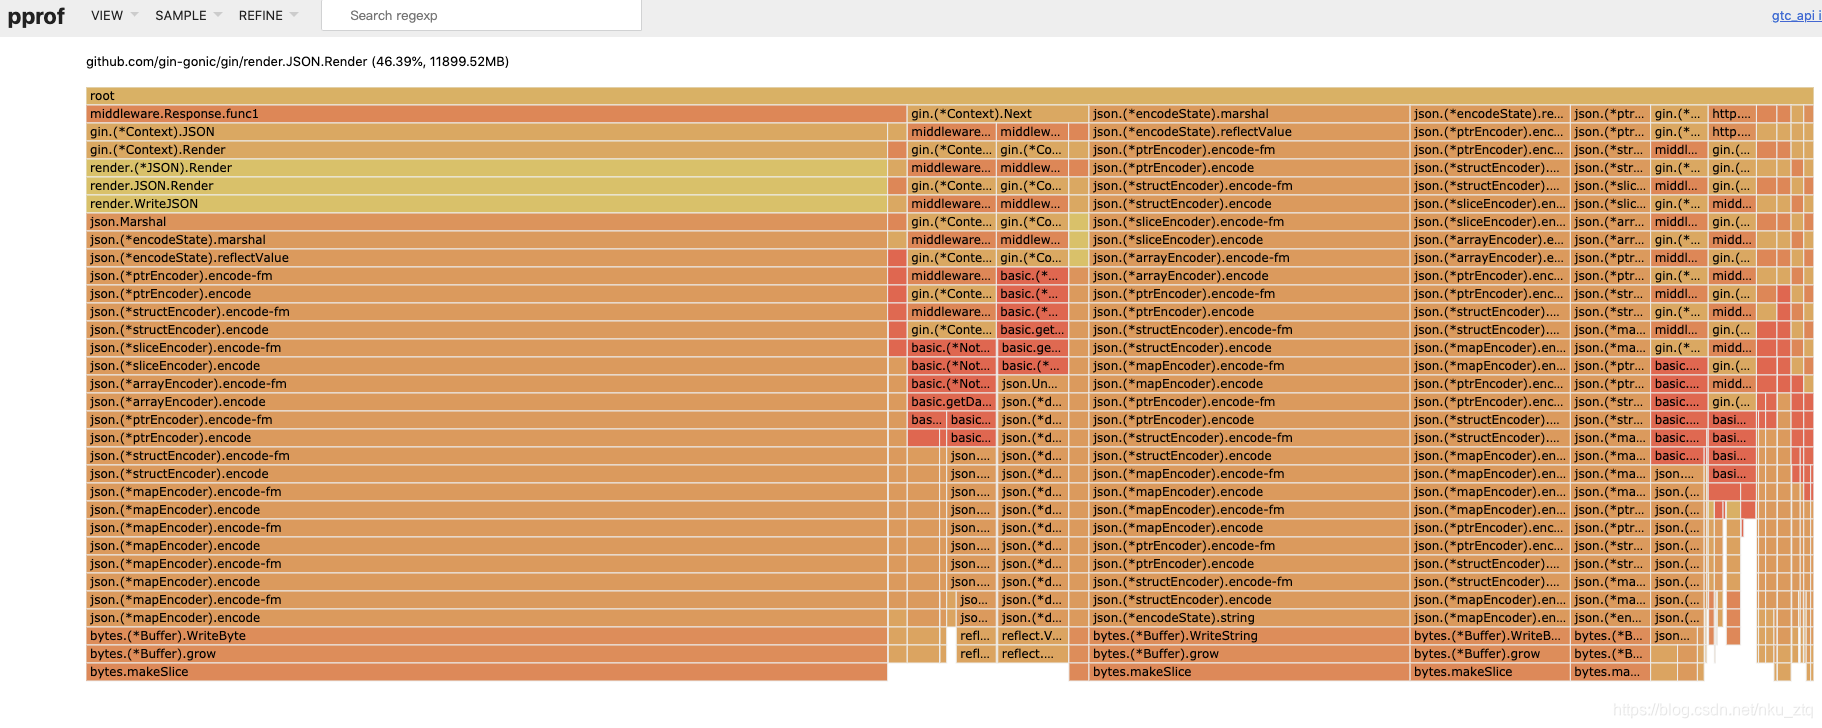
在view选项卡中也可选择火焰图模式:
- 首先在api server中import pprof包并配置对外暴露的端口:
