目录
这里使用的软件版本是win系统Python3和matplotlib3.1.1
Matplotlib 可能是 Python 2D绘图领域使用最广泛的库。
Matplotlib官方文档https://matplotlib.org/
Matplotlib官方案例库https://matplotlib.org/gallery/index.html

本文内容:
导库matplotlib
可以使用豆瓣镜像进行加速
#不加速
pip install matplotlib

#镜像加速
pip install -i https://pypi.doubanio.com/simple/ matplotlib
matplotlib基本流程与语法
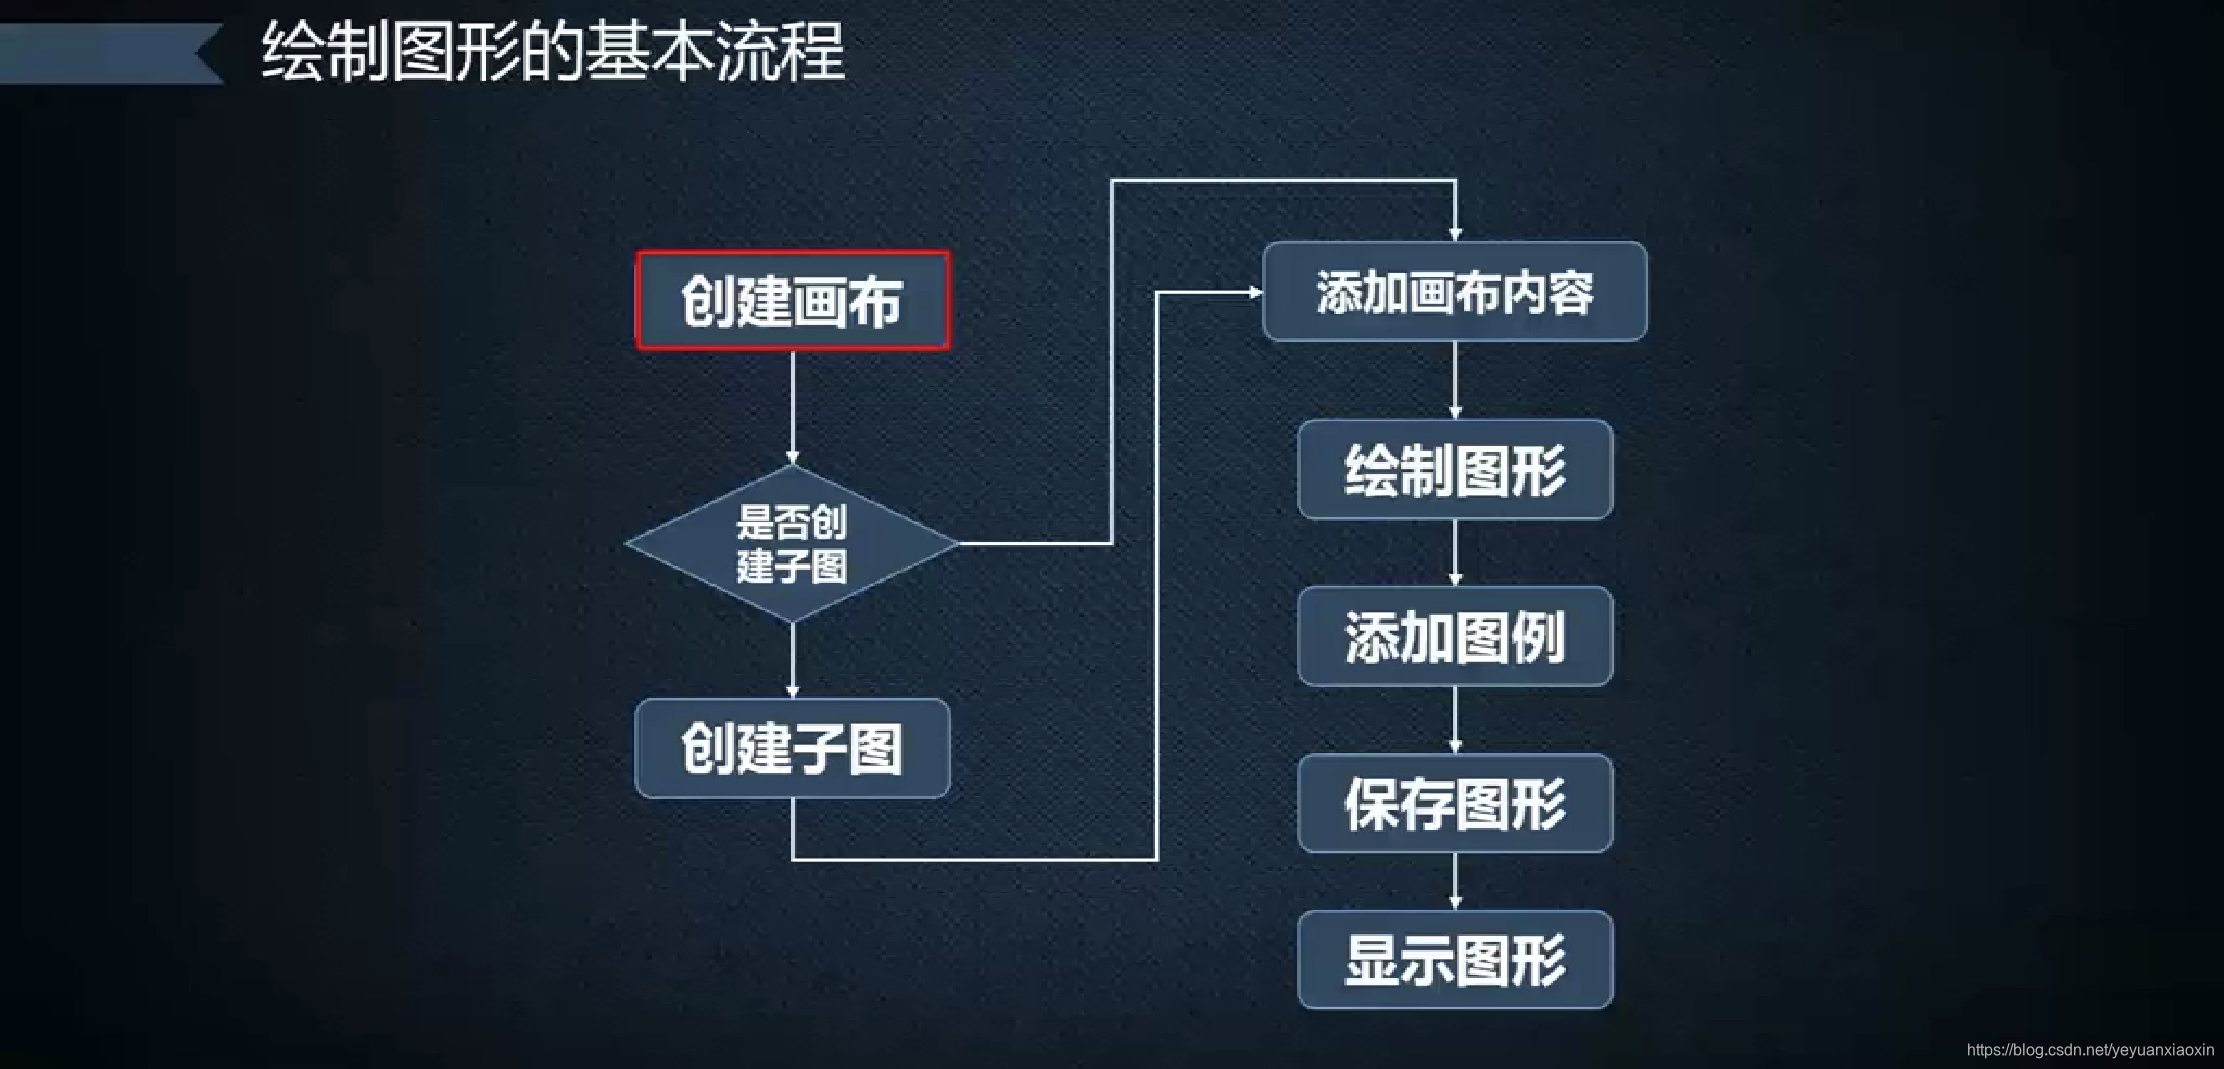
1、创建画布figure()

2、创建子图figure.add_subplot()

3、设置画布

4、绘制图形

5、添加图例plt.legend()
6、保存图形plt.savefig()

7、显示图形plt.show()
8、设置动态rc参数


【注意】Matplotlib 默认情况不支持中文,会出现乱码
【1】可以通过设置rc参数显示中文,并使用系统的字体:
通过设置font.sans-serif、axes.unicode_minus参数改变绘图时的字体,使得图形可以正常显示中文
sans-serif是无衬线字体,是一种通用的字体表,常见的有Arial,幼圆,隶书等
plt.rcParams['font.sans-serif‘]='SimHei' #指定默认字体为黑体,STFangsong(仿宋)
plt.rcParams['axes.unicode_minus]=False #用来正常显示负号
【2】我们也可以使用以下简单的方法来解决:
首先下载字体(注意系统):https://www.fontpalace.com/font-details/SimHei/
SimHei.ttf 文件放在当前执行的代码文件中:
import matplotlib

# fname 为 你下载的字体库路径,注意 SimHei.ttf 字体的路径
zhfont1 = matplotlib.font_manager.FontProperties(fname="SimHei.ttf")
【3】查询系统字体的方式
from matplotlib import pyplot as plt
import matplotlib
a=sorted([f.name for f in matplotlib.font_manager.fontManager.ttflist])

for i in a:
    print(i)
打印出你的 font_manager 的 ttflist 中所有注册的名字
案例代码
import matplotlib.pyplot as plt

plt.rcParams['font.sans-serif‘]='SimHei' #指定默认字体为黑体,STFangsong(仿宋)
plt.rcParams['axes.unicode_minus]=False #用来正常显示负号

# 创建画布,一般设置长宽尺寸和分辨率即可
plt.figure(figsize=(10,6), #图像的长和宽(英寸)
           dpi=80,#分辨率(点/英寸)
           facecolor=,#绘图区域的背景颜色
           edgecolor=,#绘图区域边缘的颜色
           frameon=True#是否绘制图像边缘默认绘制
           )

#设置X,y_1,y_2数据
x =
y_1 =
y_2 =

# 创建图像
plt.plot(x, y_1,
         color="blue",
         linewidth=1.0,
         linestyle="-",
         label="cosine"#设置标签才能显示图例
         )

plt.plot(x, y_2,
         color="red",
         linewidth=1.0,
         linestyle="-",
         label="sinine"#设置标签才能显示图例
         )

#设置x,y轴界限
plt.xlim(-4.0,4.0)
plt.ylim(-1.0,1.0)

#设置x,y轴标度
plt.xticks(np.linspace(-4,4,9,endpoint=True))
plt.yticks(np.linspace(-1,1,5,endpoint=True))

#设置图例
plt.legend(loc='upper left')

#保存图像
plt.savefig("../figures/exercice_2.png",dpi=72)

#在屏幕上显示图像
plt.show()
子图设置plt.subplot
from pylab import *

subplot(1,2,1) #设置一个1行2列的子图,并在第一个位置进行绘图
xticks([]), yticks([])
text(0.5,0.5, 'subplot(2,2,1)',ha='center',va='center',size=24,alpha=.5)

subplot(1,2,2)#设置一个1行2列的子图,并在第二个位置进行绘图
xticks([]), yticks([])
text(0.5,0.5, 'subplot(2,2,2)',ha='center',va='center',size=24,alpha=.5)

savefig('../figures/subplot-vertical.png', dpi=64)
show()

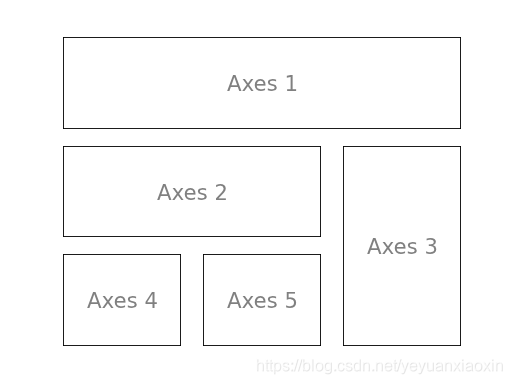
from pylab import *
import matplotlib.gridspec as gridspec

G = gridspec.GridSpec(3, 3) #设置3行3列

axes_1 = subplot(G[0, :])
xticks([]), yticks([])
text(0.5,0.5, 'Axes 1',ha='center',va='center',size=24,alpha=.5)

axes_2 = subplot(G[1,:-1])
xticks([]), yticks([])
text(0.5,0.5, 'Axes 2',ha='center',va='center',size=24,alpha=.5)

axes_3 = subplot(G[1:, -1])
xticks([]), yticks([])
text(0.5,0.5, 'Axes 3',ha='center',va='center',size=24,alpha=.5)

axes_4 = subplot(G[-1,0])
xticks([]), yticks([])
text(0.5,0.5, 'Axes 4',ha='center',va='center',size=24,alpha=.5)

axes_5 = subplot(G[-1,-2])
xticks([]), yticks([])
text(0.5,0.5, 'Axes 5',ha='center',va='center',size=24,alpha=.5)

savefig('../figures/gridspec.png', dpi=64)
show()