echarts—— 柱状图 X轴数据过多时横向拉动展示

使用echarts 柱状图数据过多时,容易挤到一起,导致排版很不清楚。

在设置option时,加上dataZoom

	    dataZoom : [
	    	{
                type: 'slider',
                show: true,
                start: 94,
                end: 100,
                handleSize: 8
            },
            {
                type: 'inside',
                start: 94,
                end: 100
            },
            {
                type: 'slider',
                show: true,
                yAxisIndex: 0,
                filterMode: 'empty',
                width: 12,
                height: '70%',
                handleSize: 8,
                showDataShadow: false,
                left: '93%'
            }
	    ]

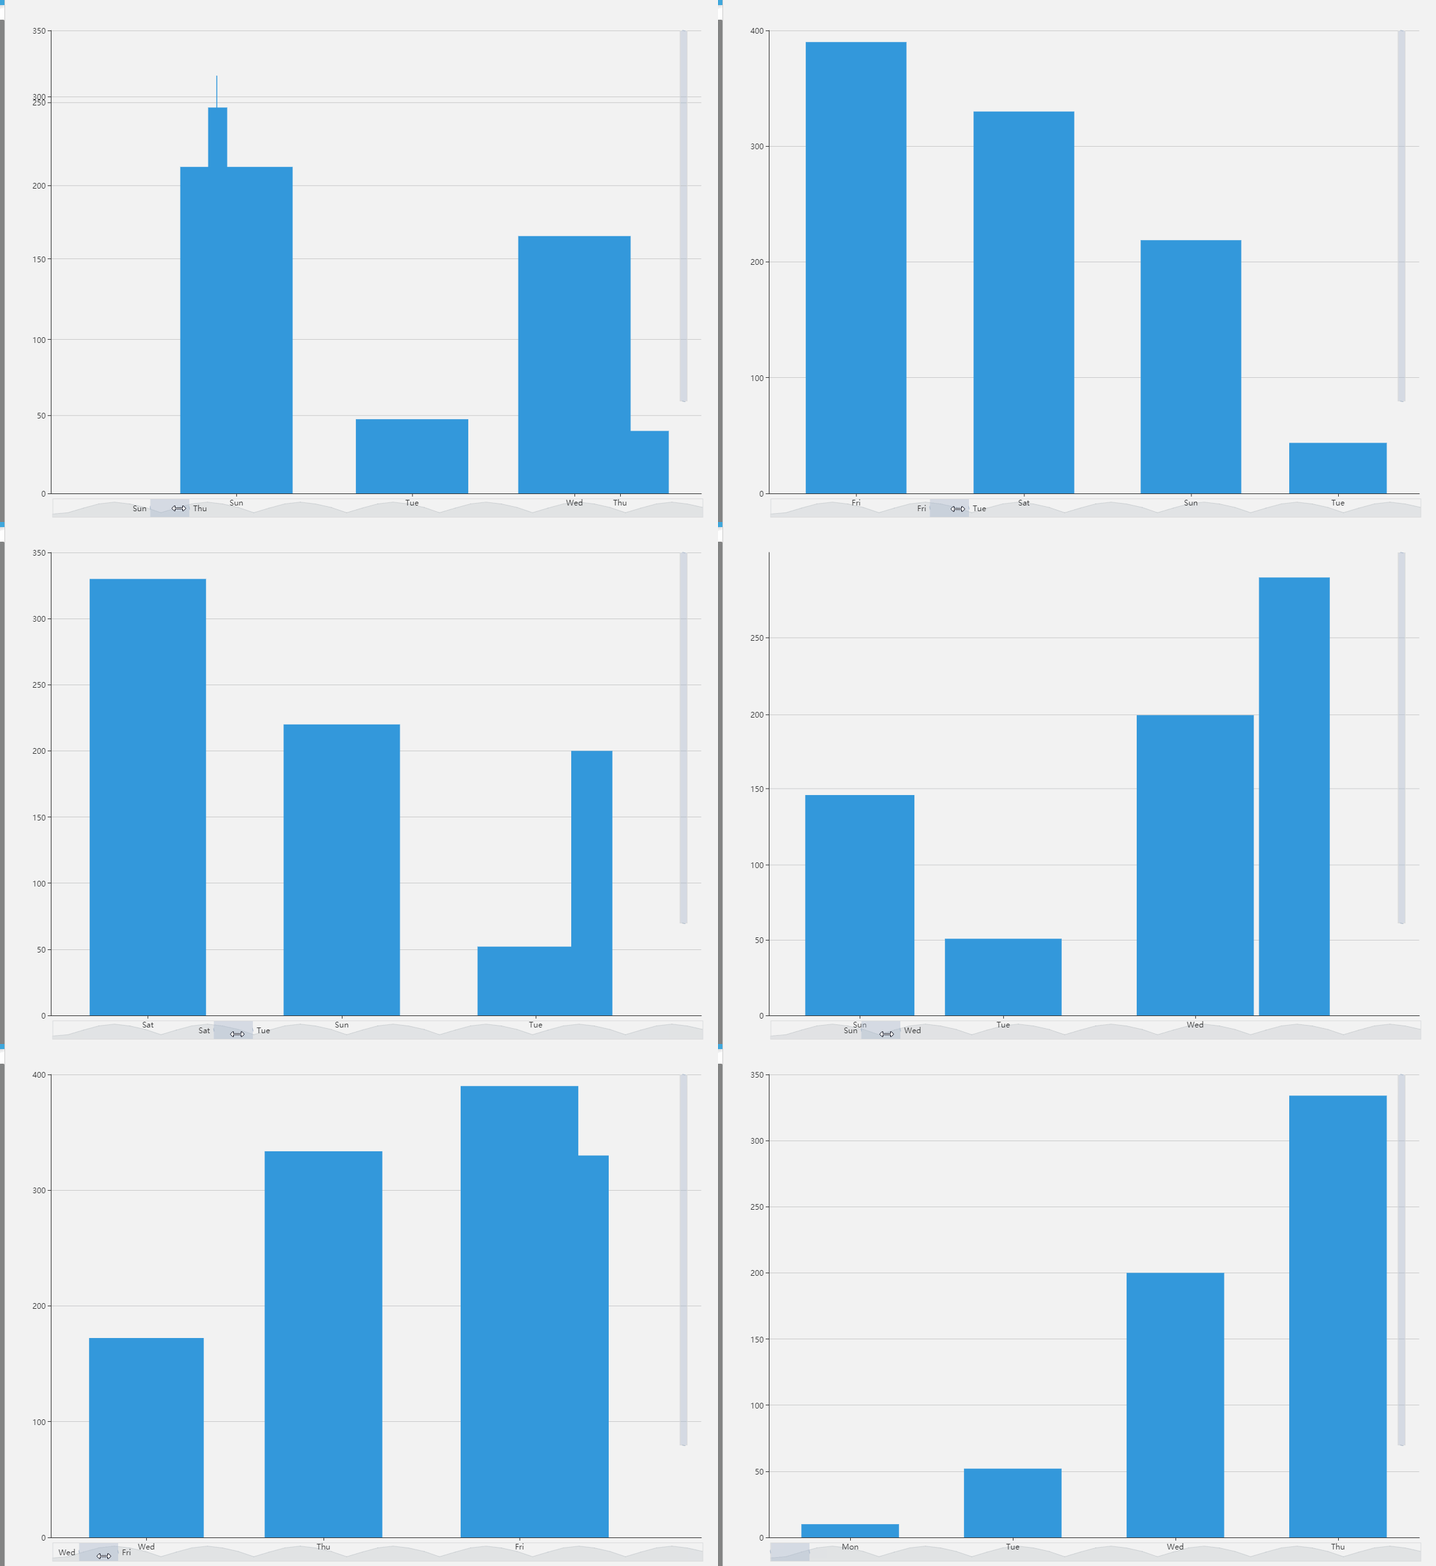
效果图:
发布了44 篇原创文章 · 获赞 15 · 访问量 5万+

猜你喜欢

转载自blog.csdn.net/Sunshine0508/article/details/90065867