countplot能够很好的画出某一个属性中各个值的统计
比如还是利用kaggle数据https://www.kaggle.com/c/cat-in-the-dat-ii
import pandas as pd
import matplotlib.pyplot as plt
import seaborn as sns

if __name__ == '__main__':
    raw_train=pd.read_csv('train.csv')
    plt.figure(figsize=(6, 6))
    ax = sns.countplot('target',data=raw_train)
    plt.show()

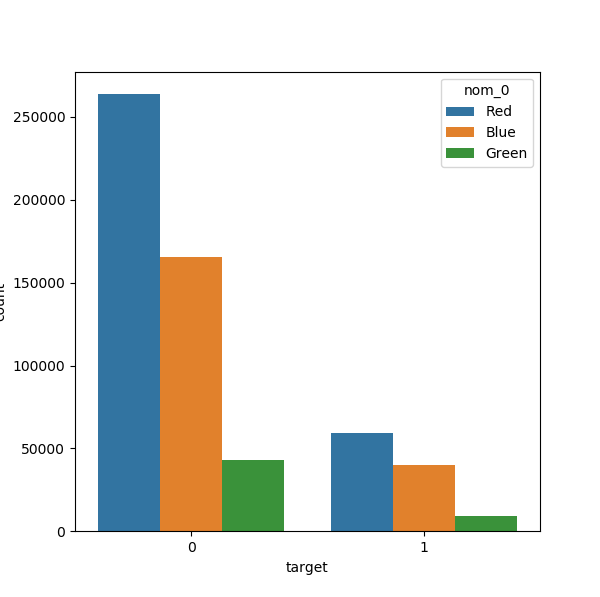
countplot还能够画出在target中0,1各个类别中属性nom_0的所占比例
import pandas as pd
import matplotlib.pyplot as plt
import seaborn as sns

if __name__ == '__main__':
    raw_train=pd.read_csv('train.csv')
    plt.figure(figsize=(6, 6))
    ax = sns.countplot('target',data=raw_train,hue='nom_0')
    plt.show()
其中的ax可以操纵画布中的对象在此处也不例外
添加标题
ax.set_title('target')
其中ax.patches表示的是每个柱子的对象(不太了解)