一、原理详解
归类:
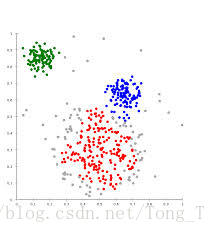
聚类(clustering) 属于非监督学习 (unsupervised learning)
无类别标记(class label)举例:
K-means 算法:
3.1 Clustering 中的经典算法,数据挖掘十大经典算法之一
3.2 算法接受参数 k ;然后将事先输入的n个数据对象划分为 k个聚类以便使得所获得的聚类满足:同一聚类中的对象相似度较高;而不同聚类中的对象相似度较小。
3.3 算法思想:
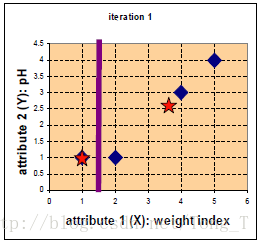
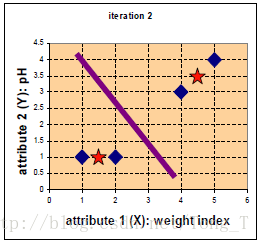
以空间中k个点为中心进行聚类,对最靠近他们的对象归类。通过迭代的方法,逐次更新各聚类中心的值,直至得到最好的聚类结果
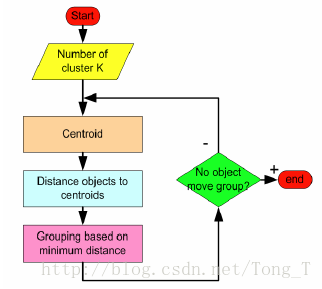
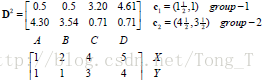
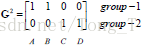
3.4 算法描述:(1)适当选择c个类的初始中心; (2)在第k次迭代中,对任意一个样本,求其到c各中心的距离,将该样本归到距离最短的中心所在 的类; (3)利用均值等方法更新该类的中心值; (4)对于所有的c个聚类中心,如果利用(2)(3)的迭代法更新后,值保持不变,则迭代结束,否则继续迭代。3.5 算法流程:
输入:k, data[n];
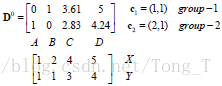
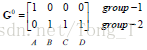
(1) 选择k个初始中心点,例如c[0]=data[0],…c[k-1]=data[k-1];
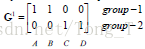
(2) 对于data[0]….data[n], 分别与c[0]…c[k-1]比较,假定与c[i]差值最少,就标记为i;
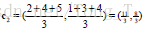
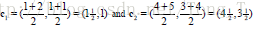
(3) 对于所有标记为i点,重新计算c[i]={ 所有标记为i的data[j]之和}/标记为i的个数;
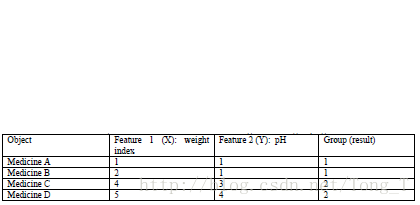
(4) 重复(2)(3),直到所有c[i]值的变化小于给定阈值。举例:
停止
优点:速度快,简单
缺点:最终结果跟初始点选择相关,容易陷入局部最优,需直到k值
二、代码实现
# -*- coding:utf-8 -*-
import numpy as np
import pandas as pd
# 数据来源是iris数据集,一共150例,其中分为3类:iris-setosa, iris-versicolor,iris-virginica
def read_data():
IRIS_TRAIN_URL = 'iris_training.csv'
names = ['sepal-length', 'sepal-width', 'petal-length', 'petal-width', 'species']
train = pd.read_csv(IRIS_TRAIN_URL, names=names, skiprows=1)
x_train_ = train.drop('species', axis=1)
x_train = np.array(x_train_)
y_train_ = train.species
y_train = np.array(y_train_).tolist()
return x_train, y_train
# Function: K Means
# -------------
# K-Means is an algorithm that takes in a dataset and a constant
# k and returns k centroids (which define clusters of data in the
# dataset which are similar to one another).
def k_means(X, k, max_It):
num_points, num_dim = X.shape
dataset = np.zeros((num_points, num_dim + 1))
dataset[:, :-1] = X
# Initialize centroids randomly
centroids = dataset[np.random.randint(num_points, size=k), :]
# Randomly assign labels to initial centorid
centroids[:, -1] = range(1, k + 1)
# Initialize book keeping vars.
iterations = 0
old_centroids = None
# Run the main k-means algorithm
while not should_stop(old_centroids, centroids, iterations, max_It):
print("iteration: \n", iterations)
print("dataset: \n", dataset)
print("centroids: \n", centroids)
# Save old centroids for convergence test. Book keeping.
old_centroids = np.copy(centroids)
iterations += 1
# Assign labels to each datapoint based on centroids
update_labels(dataset, centroids)
# Assign centroids based on datapoint labels
centroids = get_centroids(dataset, k)
# We can get the labels too by calling getLabels(dataset, centroids)
return dataset
# Function: Should Stop
# -------------
# Returns True or False if k-means is done. K-means terminates either
# because it has run a maximum number of iterations OR the centroids
# stop changing.
def should_stop(old_centroids, centroids, iterations, max_It):
if iterations > max_It:
return True
return np.array_equal(old_centroids, centroids)
# Function: Get Labels
# -------------
# Update a label for each piece of data in the dataset.
def update_labels(dataset, centroids):
# For each element in the dataset, chose the closest centroid.
# Make that centroid the element's label.
num_points, num_dim = dataset.shape
for i in range(0, num_points):
dataset[i, -1] = get_label_from_closest_centroid(dataset[i, :-1], centroids)
def get_label_from_closest_centroid(dataset_row, centroids):
label = centroids[0, -1]
min_dist = np.linalg.norm(dataset_row - centroids[0, :-1])
for i in range(1, centroids.shape[0]):
dist = np.linalg.norm(dataset_row - centroids[i, :-1])
if dist < min_dist:
min_dist = dist
label = centroids[i, -1]
print("min_dist:", min_dist)
return label
# Function: Get Centroids
# -------------
# Returns k random centroids, each of dimension n.
def get_centroids(dataset, k):
# Each centroid is the geometric mean of the points that
# have that centroid's label. Important: If a centroid is empty (no points have
# that centroid's label) you should randomly re-initialize it.
result = np.zeros((k, dataset.shape[1]))
for i in range(1, k + 1):
one_cluster = dataset[dataset[:, -1] == i, :-1]
result[i - 1, :-1] = np.mean(one_cluster, axis=0)
result[i - 1, -1] = i
return result
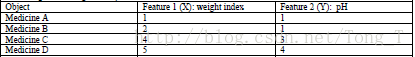
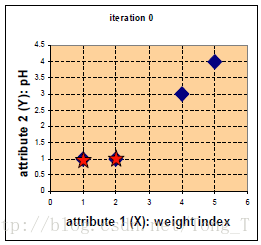
# 任务1:完成上面的例子
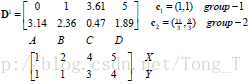
x1 = np.array([1, 1])
x2 = np.array([2, 1])
x3 = np.array([4, 3])
x4 = np.array([5, 4])
testX = np.vstack((x1, x2, x3, x4))
result = k_means(testX, 2, 10)
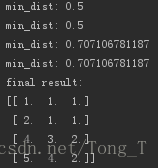
print("final result:")
print(result)
# 任务2:用iris数据集测试聚类的效果
x_train, y_train = read_data()
result = k_means(x_train, 3, 100)
print("final result:")
right = 0
for k, v in enumerate(result):
if int(v[-1] - 1) == y_train[k]:
right += 1
print('accuracy:' + str((right / 150) * 100) + '%')
# print(result)任务1的结果:
任务二的结果:
150例K-means聚类算法的分类能力表现的不是特别好,这个特别依赖刚开始的聚类中心的选择,选择的好的话,分类表现还算可以,但选择不好的话,分类效果很差。所以k-means的缺点是最终结果跟初始点选择相关,容易陷入局部最优,需直到k值。