Matplotlib有两个模块:
1) 绘图API:pyplot, 可这样导入import matplotlib.pyplot as plt
2)集成库:pylab, 是matplotlib Scipy Numpy的集成库
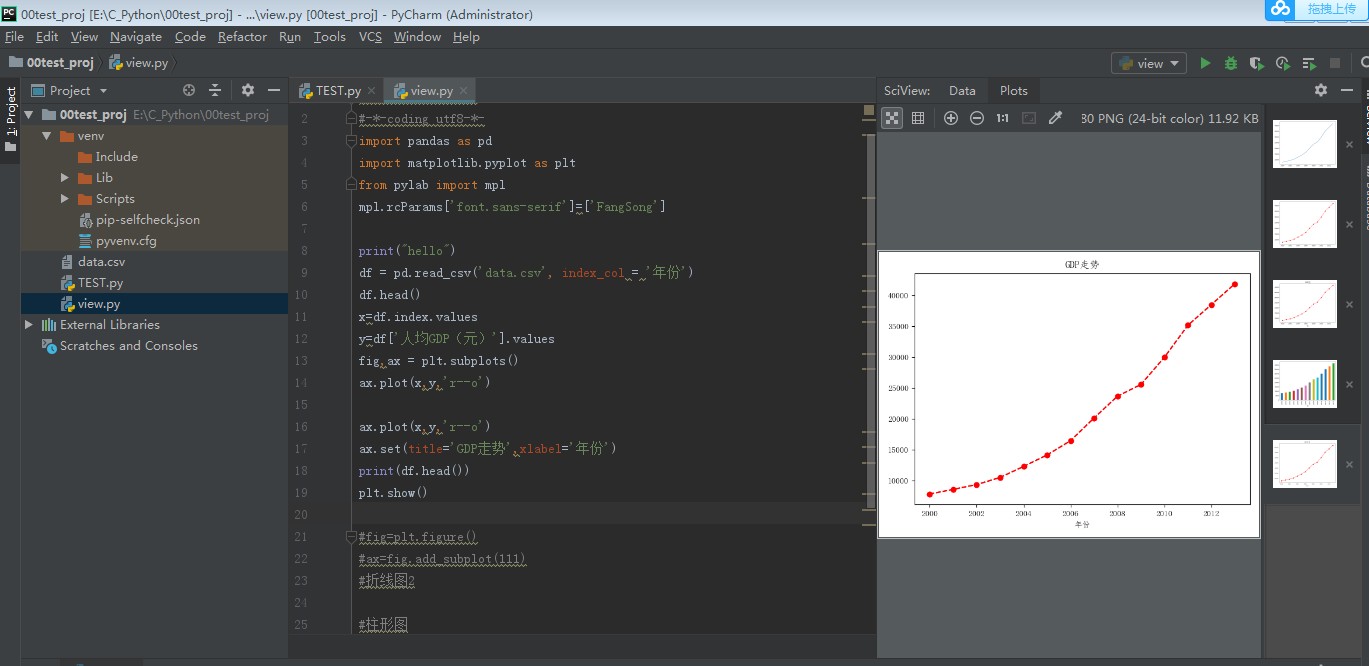
import pandas as pd
import matplotlib.pyplot as plt
from pylab import mpl
#设置标题字体
mpl.rcParams['font.sans-serif']=['FangSong']

df = pd.read_csv('data.csv', index_col = '年份')
df.head()
#dataframe读取数据的方式,行属性
x=df.index.values
#dataframe读取数据的方式,列名
y=df['人均GDP(元)'].values
#构造figure对象 ,和子窗口
fig,ax = plt.subplots()
ax.plot(x,y,'r--o')
ax.set(title='GDP走势',xlabel='年份')
print(df.head())
plt.show()
#第二种画折线图的方式2
#fig=plt.figure()
#设置subplot(x,y,z) x:行数 y:列数,z:接下来Plot画图位置,放在第几个自窗口
#ax=fig.add_subplot(111)

#柱形图
#df['人均GDP(元)'].plot(kind='bar')
#plt.show()
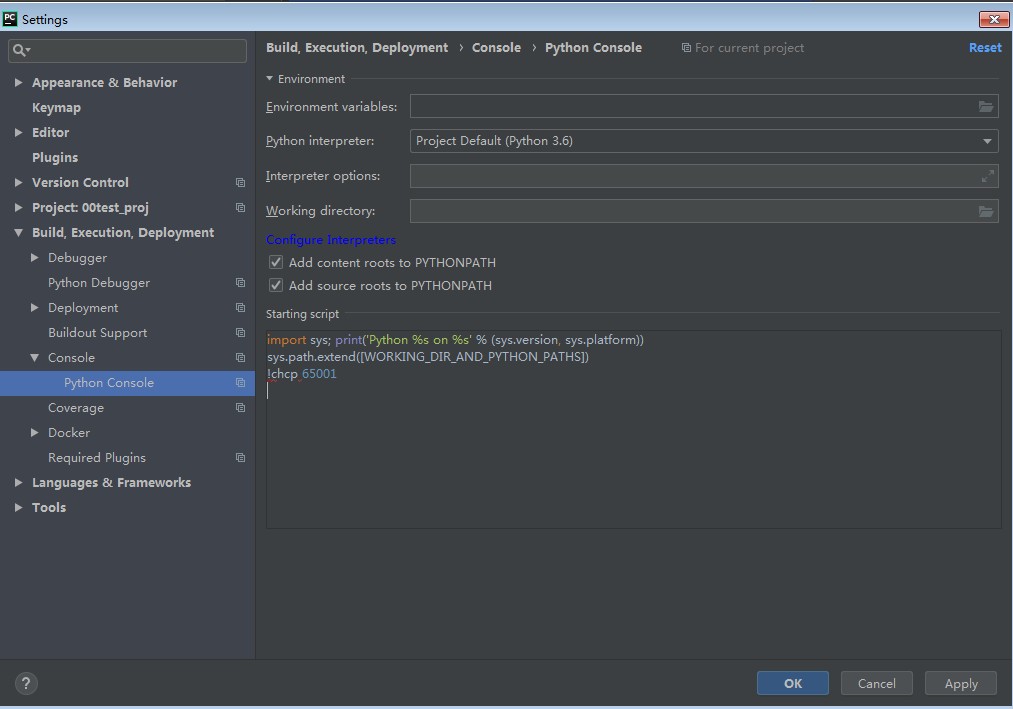
加上!chcp 65001,解决pycharm里的python console不识别中文的问题