1、plt.subplot()
import matplotlib.pyplot as plt

# Integer subplot specification must be a three digit number
# 前两位代表横竖长度比
# 左边的代表横,中间的代标纵坐标,右边的则表示绘图位置(当横纵比不是1:1时)
ax1, ax2, ax3 = plt.subplot(231), plt.subplot(232), plt.subplot(233)
ax4, ax5, ax6 = plt.subplot(234), plt.subplot(235), plt.subplot(236)
# 被注释的地方xy(x, y)和插入文本的地方xytext(x, y)
ax2.annotate("Test", xy=(0.5, 0.5), xycoords=ax1.transData,
             xytext=(0.5, 0.5), textcoords=ax2.transData,
             arrowprops=dict(arrowstyle="<-"))
ax3.annotate("ax3", xy=(0.5, 0.5), xytext=(0.5, 0.5))
ax4.annotate("ax4", xy=(0.5, 0.5), xytext=(0.5, 0.5))
ax5.annotate("ax5", xy=(0.5, 0.5), xytext=(0.5, 0.5))
ax6.annotate("ax6", xy=(0.5, 0.5), xytext=(0.5, 0.5))
plt.show()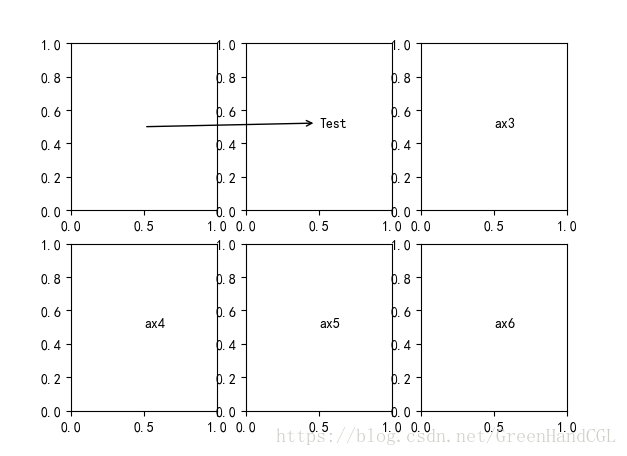
2、annotate
- 被注释的地方xy(x, y)和插入文本的地方xytext(x, y)
- xycoords和textcoords指定xy和xytext的坐标系。默认为data(使用轴域数据坐标系)
| 参数 | 坐标系 |
|'figure points'
| 距离图形左下角的点数量 |
|
'figure pixels'
| 距离图形左下角的像素数量 |
|
'figure fraction'
| 0,0 是图形左下角,1,1 是右上角 |
|
'axes points'
| 距离轴域左下角的点数量 |
|
'axes pixels'
| 距离轴域左下角的像素数量 |
|
'axes fraction'
| 0,0 是轴域左下角,1,1 是右上角 |
| 'data' | 使用轴域数据坐标系 |
import matplotlib.pyplot as plt
from numpy import *


ax1 = plt.subplot(111)

t = arange(0.0, 5.0, 0.01)
s = cos(2*pi*t)
line = plt.plot(t, s, lw=2)
# 被注释的地方xy(x, y)和插入文本的地方xytext(x, y)
# xycoords和textcoords指定xy和xytext的坐标系。默认为data(使用轴域数据坐标系)

ax1.annotate('local max', xy=(2, 1), xytext=(3, 1.5),
            arrowprops=dict(facecolor='black'))

plt.ylim(-2, 2)
plt.show()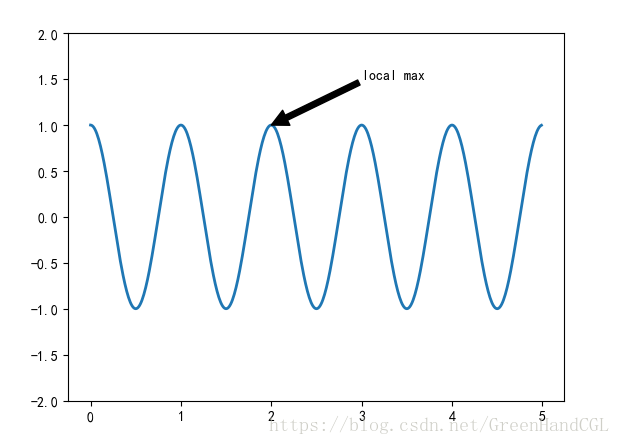
3、在机器学习实战的第三章,我们还用到了箭头(arrow)和文本框(box)
import matplotlib.pyplot as plt

# boxstyle文本框样式, fc(face color)背景透明度
decisionNode = dict(boxstyle="round4, pad=0.5", fc="0.8")
leafNode = dict(boxstyle="circle", fc="0.8")
# 箭头样式
arrow_args = dict(arrowstyle="<-")


def plotNode(nodeTxt, centerPt, parentPt, nodeType):
    createPlot.ax1.annotate(nodeTxt, xy=parentPt, xycoords="axes fraction",
                            xytext=centerPt, textcoords="axes fraction", va="center",
                            ha="center", bbox=nodeType, arrowprops=arrow_args)


def createPlot():
    fig = plt.figure(1, facecolor="white")
    fig.clf()
    createPlot.ax1 = plt.subplot(111, frameon=False)
    plotNode('决策点', (0.5, 0.1), (0.1, 0.5), decisionNode)
    plotNode('叶节点', (0.8, 0.1), (0.3, 0.8), leafNode)
    # plt.rcParams['font.sans-serif'] = ['SimHei']
    plt.show()

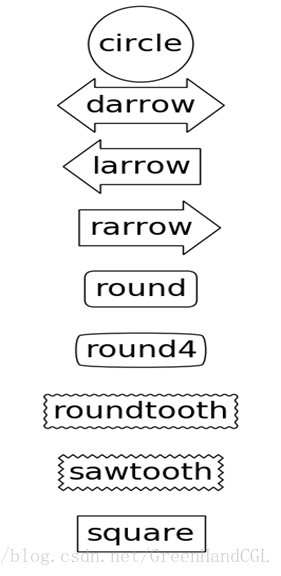
createPlot()- Annotating with Text with Box:boxstyle
Class |
Name |
Attrs |
Circle |
circle |
pad=0.3 |
DArrow |
darrow |
pad=0.3 |
LArrow |
larrow |
pad=0.3 |
RArrow |
rarrow |
pad=0.3 |
Round |
round |
pad=0.3,rounding_size=None |
Round4 |
round4 |
pad=0.3,rounding_size=None |
Roundtooth |
roundtooth |
pad=0.3,tooth_size=None |
Sawtooth |
sawtooth |
pad=0.3,tooth_size=None |
Square |
square |
pad=0.3 |
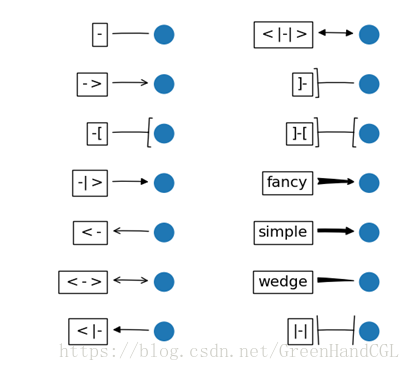
- Annotating with Arrow:arrowstyle
Name |
Attrs |
- |
None |
-> |
head_length=0.4,head_width=0.2 |
-[ |
widthB=1.0,lengthB=0.2,angleB=None |
|-| |
widthA=1.0,widthB=1.0 |
-|> |
head_length=0.4,head_width=0.2 |
<- |
head_length=0.4,head_width=0.2 |
<-> |
head_length=0.4,head_width=0.2 |
<|- |
head_length=0.4,head_width=0.2 |
<|-|> |
head_length=0.4,head_width=0.2 |
fancy |
head_length=0.4,head_width=0.4,tail_width=0.4 |
simple |
head_length=0.5,head_width=0.5,tail_width=0.2 |
wedge |
tail_width=0.3,shrink_factor=0.5 |