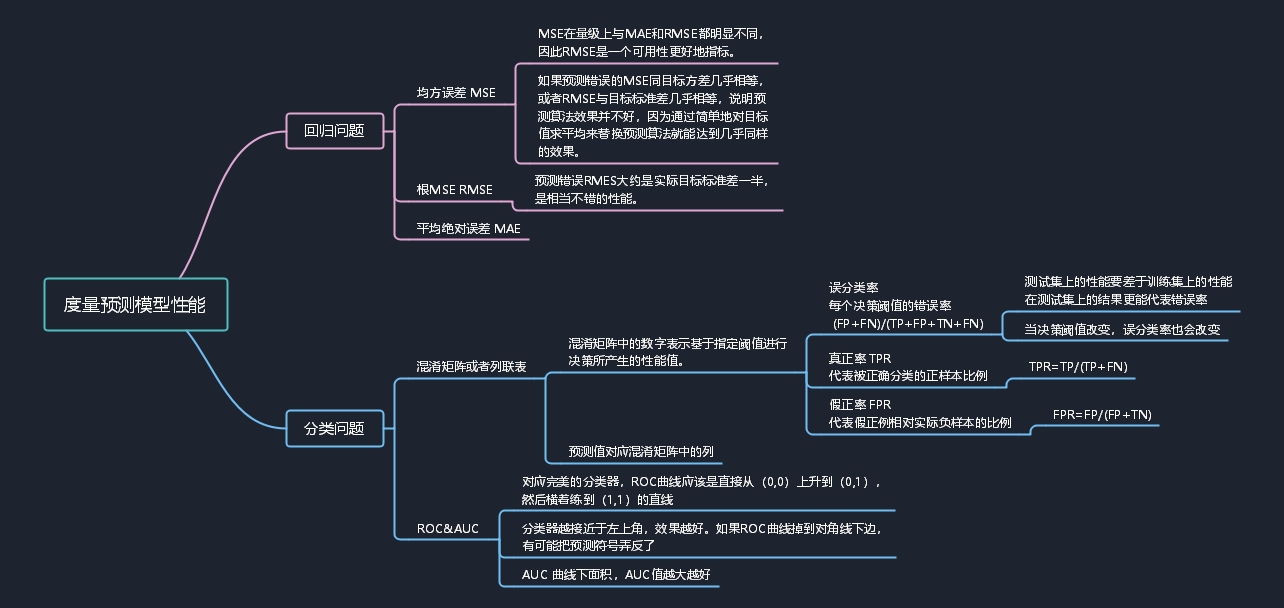
直接上我的思维导图吧:
学习的代码及备注
  1 __author__ = 'mike-bowles'
  2 #use scikit learn package to perform linear regression
  3 #read in the rocks versus mines data set from uci.edu data repository
  4 # import urllib2  我没有用网上的数据,是先下载下来,直接本地读取的,所以取消掉了。
  5 import numpy
  6 import random
  7 from sklearn import datasets, linear_model
  8 from sklearn.metrics import roc_curve, auc
  9 import pylab as pl
 10
 11
 12 def confusionMatrix(predicted, actual, threshold): # predicted 利用回归模型后X输入得到的值,
 13 #                                                    actual X所对应的真实的值, threshold 阈值
 14     if len(predicted) != len(actual): return -1 #判断测试的数量与实际的数量是否一致
 15     tp = 0.0
 16     fp = 0.0
 17     tn = 0.0
 18     fn = 0.0
 19     for i in range(len(actual)):
 20         if actual[i] > 0.5: #labels that are 1.0  (positive examples)
 21                             # 为什么是>0.5,我想了好久,最后发现因为本例中为M时赋值1,为R时赋值0
 22             if predicted[i] > threshold:
 23                 tp += 1.0 #correctly predicted positive
 24             else:
 25                 fn += 1.0 #incorrectly predicted negative
 26         else:              #labels that are 0.0 (negative examples)
 27             if predicted[i] < threshold:
 28                 tn += 1.0 #correctly predicted negative
 29             else:
 30                 fp += 1.0 #incorrectly predicted positive
 31     rtn = [tp, fn, fp, tn]
 32     return rtn
 33
 34
 35 #read data from uci data repository
 36 # target_url = "https://archive.ics.uci.edu/ml/machine-learning-databases/undocumented/connectionist-bench/sonar/sonar.all-data"
 37 # data = urllib2.urlopen(target_url)
 38 # 这里我改成了:
 39 target_url_file = open('sonar.all-data','r')
 40 data = target_url_file.readlines()
 41 target_url_file.close()
 42
 43
 44 #arrange data into list for labels and list of lists for attributes
 45 xList = []
 46 labels = []
 47 for line in data:
 48     #split on comma
 49     row = line.strip().split(",")
 50     #assign label 1.0 for "M" and 0.0 for "R"
 51     if(row[-1] == 'M'):
 52         labels.append(1.0)
 53     else:
 54         labels.append(0.0)
 55     #remove label from row
 56     row.pop()
 57     #convert row to floats
 58     floatRow = [float(num) for num in row]
 59     xList.append(floatRow)  #注意了xList是一个含208个列表的列表
 60
 61 #divide attribute matrix and label vector into training(2/3 of data) and test sets (1/3 of data)
 62 indices = range(len(xList))
 63 xListTest = [xList[i] for i in indices if i%3 == 0 ]
 64 xListTrain = [xList[i] for i in indices if i%3 != 0 ]
 65 labelsTest = [labels[i] for i in indices if i%3 == 0]
 66 labelsTrain = [labels[i] for i in indices if i%3 != 0]
 67
 68 #form list of list input into numpy arrays to match input class for scikit-learn linear model
 69 xTrain = numpy.array(xListTrain);    #将列表转为可以方便处理的numpy.array
 70 yTrain = numpy.array(labelsTrain);
 71 xTest = numpy.array(xListTest);
 72 yTest = numpy.array(labelsTest)
 73
 74 #check shapes to see what they look like
 75 print("Shape of xTrain array", xTrain.shape)
 76 print("Shape of yTrain array", yTrain.shape)
 77 print("Shape of xTest array", xTest.shape)
 78 print("Shape of yTest array", yTest.shape)
 79
 80 #train linear regression model
 81 rocksVMinesModel = linear_model.LinearRegression()
 82 rocksVMinesModel.fit(xTrain,yTrain) #利用linear_model.LinearRegression()包进行线性回归
 83
 84 #generate predictions on in-sample error
 85 trainingPredictions = rocksVMinesModel.predict(xTrain) #用训练集的X导入得到回归模型算出的预测值,注意不是yTrain
 86 print("Some values predicted by model", trainingPredictions[0:5], trainingPredictions[-6:-1])
 87
 88 #generate confusion matrix for predictions on training set (in-sample)
 89 # 一定理解 in-sample 和 out-of-sample 一个是训练集,一个是测试集
 90 confusionMatTrain = confusionMatrix(trainingPredictions, yTrain, 0.5)
 91 #pick threshold value and generate confusion matrix entries
 92 tp = confusionMatTrain[0]; fn = confusionMatTrain[1]; fp = confusionMatTrain[2]; tn = confusionMatTrain[3]
 93
 94 print("tp = " + str(tp) + "\tfn = " + str(fn) + "\n" + "fp = " + str(fp) + "\ttn = " + str(tn) + '\n')
 95 # 根据输出理解\t和\n,并注意写法。
 96
 97 #generate predictions on out-of-sample data
 98 testPredictions = rocksVMinesModel.predict(xTest)  #用测试集数据导入训练好的模型
 99
100 #generate confusion matrix from predictions on out-of-sample data
101 conMatTest = confusionMatrix(testPredictions, yTest, 0.5)
102 #pick threshold value and generate confusion matrix entries
103 tp = conMatTest[0]; fn = conMatTest[1]; fp = conMatTest[2]; tn = conMatTest[3]
104 print("tp = " + str(tp) + "\tfn = " + str(fn) + "\n" + "fp = " + str(fp) + "\ttn = " + str(tn) + '\n')
105
106 #generate ROC curve for in-sample
107
108 fpr, tpr, thresholds = roc_curve(yTrain,trainingPredictions)
109 roc_auc = auc(fpr, tpr)
110 print( 'AUC for in-sample ROC curve: %f' % roc_auc)
111
112 # Plot ROC curve
113 pl.clf()
114 pl.plot(fpr, tpr, label='ROC curve (area = %0.2f)' % roc_auc)
115 pl.plot([0, 1], [0, 1], 'k--')
116 pl.xlim([0.0, 1.0])
117 pl.ylim([0.0, 1.0])
118 pl.xlabel('False Positive Rate')
119 pl.ylabel('True Positive Rate')
120 pl.title('In sample ROC rocks versus mines')
121 pl.legend(loc="lower right")
122 pl.show()
123
124 #generate ROC curve for out-of-sample
125 fpr, tpr, thresholds = roc_curve(yTest,testPredictions)
126 roc_auc = auc(fpr, tpr)
127 print( 'AUC for out-of-sample ROC curve: %f' % roc_auc)
128
129 # Plot ROC curve
130 pl.clf()
131 pl.plot(fpr, tpr, label='ROC curve (area = %0.2f)' % roc_auc)
132 pl.plot([0, 1], [0, 1], 'k--')
133 pl.xlim([0.0, 1.0])
134 pl.ylim([0.0, 1.0])
135 pl.xlabel('False Positive Rate')
136 pl.ylabel('True Positive Rate')
137 pl.title('Out-of-sample ROC rocks versus mines')
138 pl.legend(loc="lower right")
139 pl.show()