介绍
一般而言,性能分析可以从三个层次来考虑:应用层、系统层、代码层。
应用层主要是梳理业务方的使用方式,让他们更合理地使用,在满足使用方需求的前提下,减少无意义的调用;系统层关注服务的架构,例如增加一层缓存;代码层则关心函数的执行效率,例如使用效率更高的开方算法等。
做任何事,都要讲究方法。在很多情况下,迅速把事情最关键的部分完成,就能拿到绝大部分的收益了。其他的一些边边角角,可以慢慢地缝合。一上来就想完成 100%,往往会陷入付出了巨大的努力,却收获寥寥的境地。
性能优化这件事也一样,识别出性能瓶颈,会让我们付出最小的努力,而得到最大的回报。
Go 语言里,pprof 就是这样一个工具,帮助我们快速找到性能瓶颈,进而进行有针对性地优化。
pprof 用来监控、分析性能的
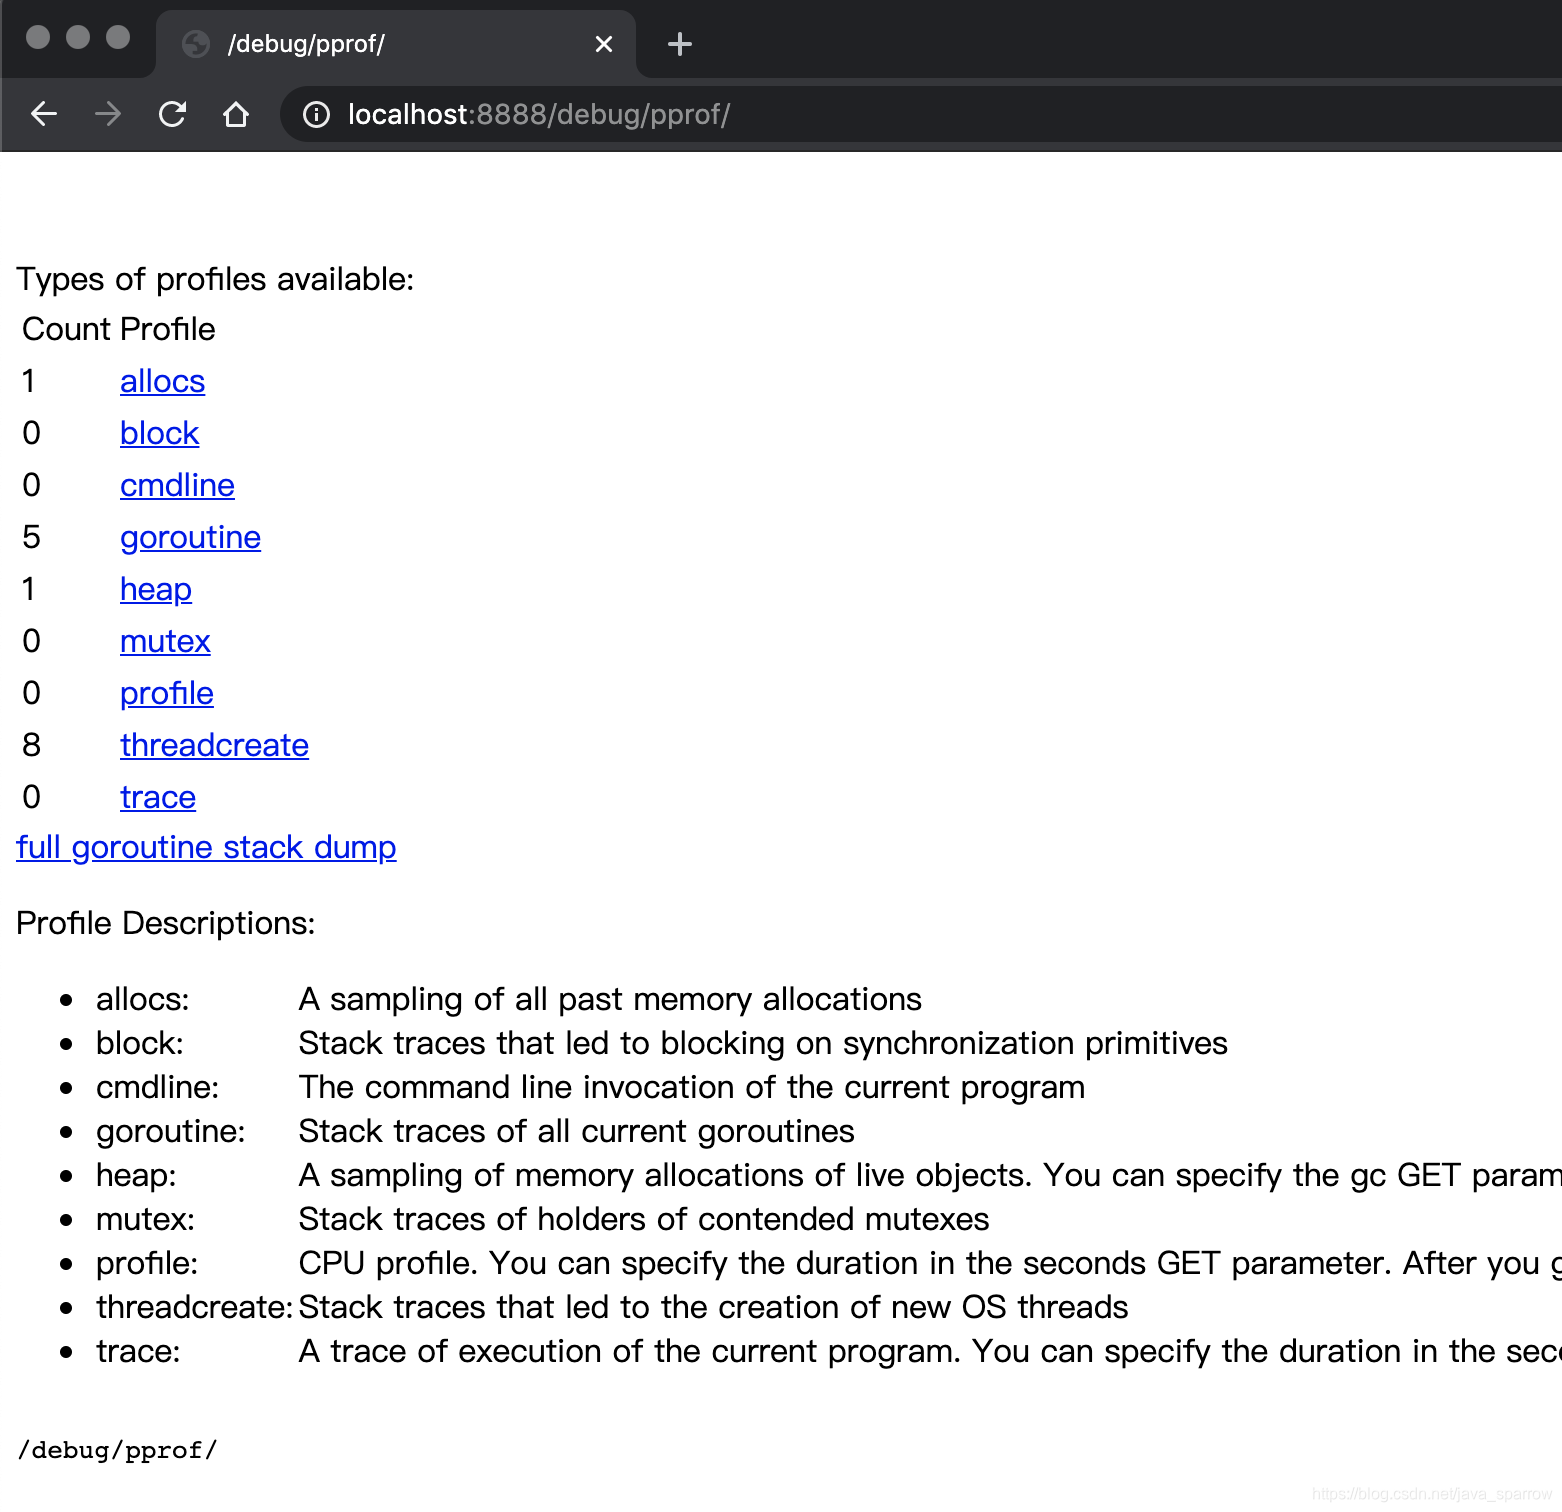
可以查看
allocs: A sampling of all past memory allocations
block: Stack traces that led to blocking on synchronization primitives
cmdline: The command line invocation of the current program
goroutine: Stack traces of all current goroutines
heap: A sampling of memory allocations of live objects. You can specify the gc GET parameter to run GC before taking the heap sample.
mutex: Stack traces of holders of contended mutexes
profile: CPU profile. You can specify the duration in the seconds GET parameter. After you get the profile file, use the go tool pprof command to investigate the profile.
threadcreate: Stack traces that led to the creation of new OS threads
trace: A trace of execution of the current program. You can specify the duration in the seconds GET parameter. After you get the trace file, use the go tool trace command to investigate the trace.
使用
	import (
	"fmt"
	"net/http"
	_ "net/http/pprof"
)
func main() {


	//defer profile.Start().Stop()

	go func() {


		if err := http.ListenAndServe("0.0.0.0:8888", nil); err != nil {


			fmt.Println("0.0.0.0:8888", err.Error())
		}
	}()

}
分析
test
go test -bench=. -cpuprofile=cpu.prof
web 页面
http://localhost:8888/debug/pprof/
查看当前程序运行时情况
goroutine profile: total 32023:32023是goroutine的总数量,
debug=2 可以看 goroutine 信息
交互
go tool pprof
list *** :查看某个函数
top 查看前几个
flat: 本函数占用的内存量。
flat%: 本函数内存占使用中内存总量的百分比。
sum%: 前面每一行flat百分比的和,比如第2行虽然的100% 是 100% + 0%。
cum: 是累计量,加入main函数调用了函数f,函数f占用的内存量,也会记进来。
cum%: 是累计量占总量的百分比。
tree
web
traces : 调用栈信息
火焰图
brew install graphviz
go tool pprof -http=":8081" /var/folders/cm/k_vl2cns1t70xzn4jm3r81sm0000gn/T/profile565242515/cpu.pprof
内存泄漏
内存泄露指的是程序运行过程中已不再使用的内存,没有被释放掉,
导致这些内存无法被使用,直到程序结束这些内存才被释放的问题。
Go虽然有GC来回收不再使用的堆内存,减轻了开发人员对内存的管理负担,
但这并不意味着Go程序不再有内存泄露问题。
在Go程序中,如果没有Go语言的编程思维,也不遵守良好的编程实践,就可能埋下隐患,造成内存泄露问题。
goroutine泄漏
go启动之后,没有符合预期退出
goroutine占用的内存就无法释放,没有办法回收,造成内存泄漏
1、goroutine 本身的栈占用的空间
2、goroutine 逃逸到堆占用的内存,
如果内存随着goroutine 增长,而不随着下降,这时候可能就出现内存泄漏的问题了
可能是channel 阻塞,无法继续执行,导致关联的内存都无法释放
channel 只读不写阻塞、写满阻塞、读不出数据阻塞等
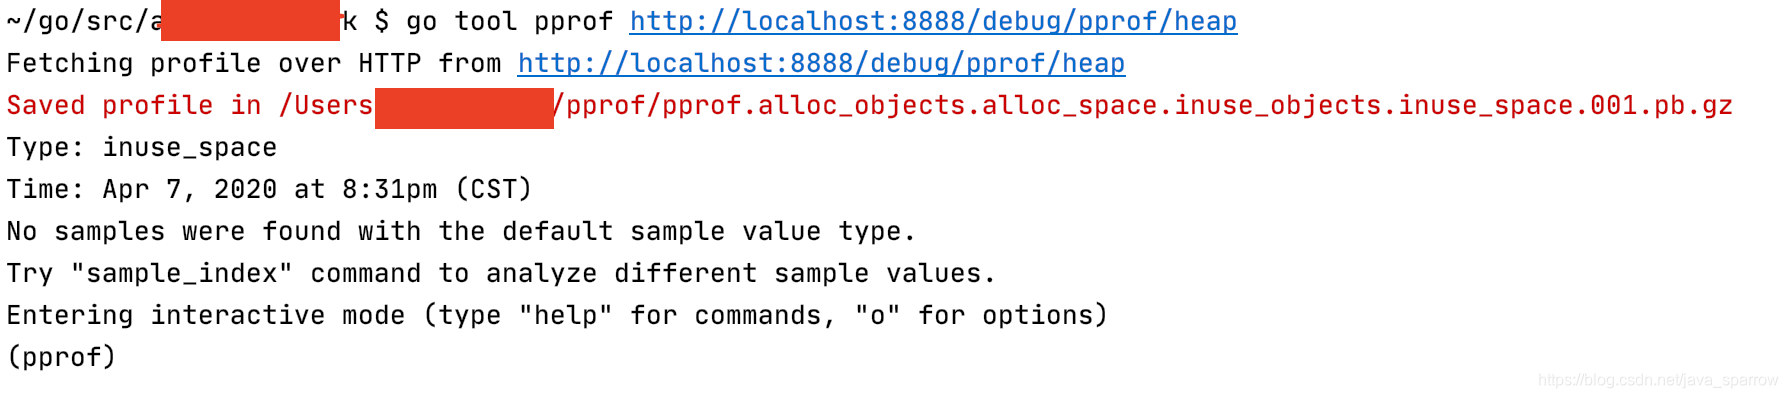
问题排查
先分析堆栈信息,看是否内存泄漏
heap可以帮助发现内存问题,
1、go tool pprof http://localhost:8888/debug/pprof/heap // 获取2个profile
2、go tool pprof -base *.pb.gz * .pb.gz //对比两个文件
3、 使用top等命令查看
4、traces 可以看出goroutine 多的地方
虽然可以找到内存使用最多的地方,但不一定是内存泄漏的地方
还需要分析具体的原因
goroutine 泄漏,heap无法发现
怎么确定是否逃逸
第一,通过编译器命令,就可以看到详细的逃逸分析过程。而指令集 -gcflags 用于将标识参数传递给 Go 编译器,涉及如下:
-m 会打印出逃逸分析的优化策略,实际上最多总共可以用 4 个 -m,但是信息量较大,一般用 1 个就可以了
-l 会禁用函数内联,在这里禁用掉 inline 能更好的观察逃逸情况,减少干扰
go build -gcflags '-m -l' main.go
二,通过反编译命令查看
go tool compile -S main.go
注:可以通过 go tool compile -help 查看所有允许传递给编译器的标识参数
参考
https://wiki.jikexueyuan.com/project/go-command-tutorial/0.12.html
https://blog.csdn.net/skh2015java/article/details/102748222
https://www.cnblogs.com/qcrao-2018/p/11832732.html
https://cizixs.com/2017/09/11/profiling-golang-program/
https://www.jianshu.com/p/81b6c0df66d1
https://blog.51cto.com/onebig/2431869?source=dra
https://www.jianshu.com/p/ba9f07a346d5
https://blog.csdn.net/sunxianghuang/article/details/93869683
https://blog.wolfogre.com/posts/go-ppof-practice/
https://mp.weixin.qq.com/s/I9xSMxy32cALSNQAN8wlnQ
http://holys.im/2016/07/01/monitor-golang-gc/
https://segmentfault.com/a/1190000016412013
https://eddycjy.com/posts/go/talk/2019-05-20-stack-heap/