代码如下:
import seaborn as sns
sns.set(style="ticks")
exercise = sns.load_dataset("exercise")
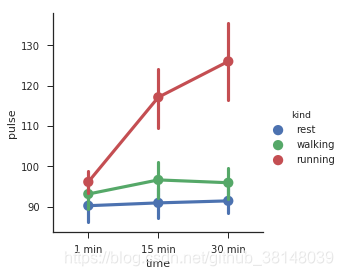
g = sns.factorplot(x="time", y="pulse", hue="kind", data=exercise)
参数kind:point默认,bar柱形图,count频次,box箱体,violin提琴,strip散点,swarm分散点
出图效果
这个函数好像要取消了
新的函数:
catplot
出图效果可以查看下面的结果:
https://blog.csdn.net/acbattle/article/details/86490450
