基本统计分析函数,适用于Series、DataFrame
| 方法 | 说明 |
|---|---|
| 方法 | 说明 |
| .sum() | 计算数据总和,默认0轴(纵轴) |
| .count() | 非NaN值的数量,默认0轴(纵轴) |
| .mean() .median() | 计算数据的算数平均值、算数中位数 |
| .var() .std() | 计算数据的方差、标准差 |
| .min() .max() | 计算数据的最大值、最小值 |
适用Series类型
| 方法 | 说明 |
|---|---|
| .argmax() .argmin() | 计算数据的最大值、最小值所在位置的索引位置(自动索引) |
| .idxmax() .idxmin() | 计算数据的最大值、最小值所在位置的索引位置(自定义索引) |
describe方法 包含上述所有方法,适用 Series、DataFrame
| 方法 | 说明 |
|---|---|
| .describe() | 针对0轴(各列进行统计汇总) |
Series
df1 = pd.Series([9, 8, 7, 6], index=['a', 'b', 'c', 'd'])
a    9
b    8
c    7
d    6
dtype: int64
-
Series的
.describe()statis = df1.describe()print(statis ) count 4.000000 mean 7.500000 std 1.290994 min 6.000000 25% 6.750000 50% 7.500000 75% 8.250000 max 9.000000 dtype: float64 -
查看
type(df1.describe())print(type(statis)) <class 'pandas.core.series.Series'> -
获取
总数count、maxprint(statis['count'])
DataFrame
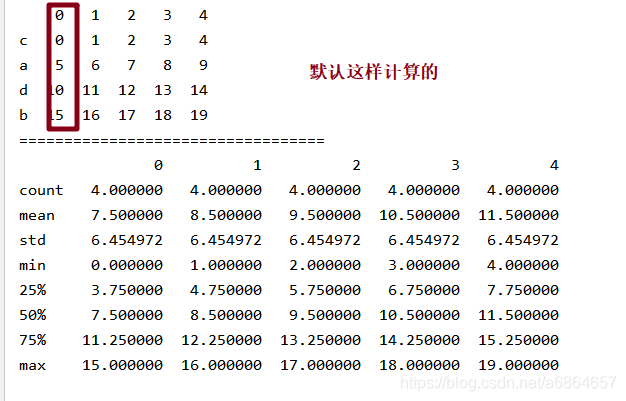
df = pd.DataFrame(np.arange(20).reshape(4, 5), index=['c', 'a', 'd', 'b'])
-
DataFrame的
.describe()statis = df.describe()
-
查看类别type(statis)
print(type(statis)) <class 'pandas.core.frame.DataFrame'> -
获取行数据df.describe()
.loc['max']
取出最大的一行statis = df.describe().loc['max'] 0 15.0 1 16.0 2 17.0 3 18.0 4 19.0 Name: max, dtype: float64 -
获取某一列值
.describe()[1][ column ]statis = df.describe()[1]count 4.000000 mean 9.500000 std 6.454972 min 2.000000 25% 5.750000 50% 9.500000 75% 13.250000 max 17.000000 Name: 2, dtype: float64
