从零到一配置 OpenAP:
概要
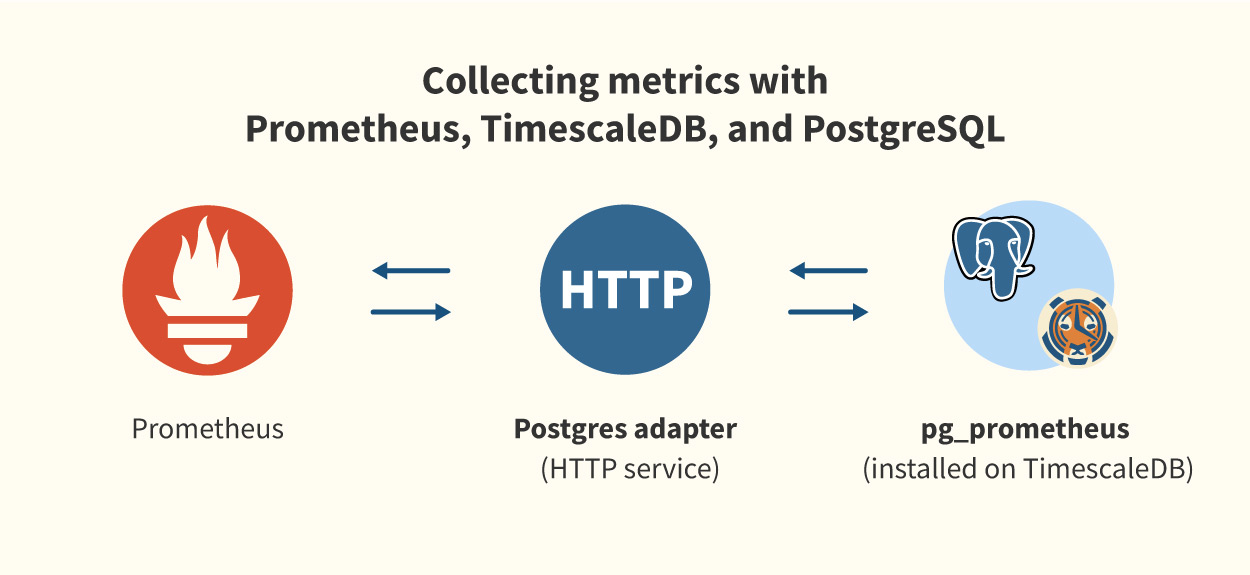
Istio采集指标prometheus+grafana方案,搭建(promethues+prometheus-postgresql-adapter+pg_prometheus) promethues·监控存储平台,
通过Istio+grafana 进行istio流量注入grafana图表展示,实现对API流量的统计。
配置 Prometheus 并且把数据存储至 Postgres (Prometheus + Postgres[TimescaleDB(pg_prometheus)])
安装配置 Prometheus
- 安装prometheus
- 配置promethues.yaml. 配置参数如下:
global: scrape_interval: 5s evaluation_interval: 5s external_labels: monitor: 'codelab-monitor' scrape_configs: - job_name: prometheus static_configs: - targets: - node-exporter-default:9100 - job_name: dx-servicemesh static_configs: - targets: - istio-telemetry.istio-system:42422 remote_write: - url: "http://prometheus-postgresql-adapter-default:9201/write" # 远程写入pg,需要用适配器转接 remote_read: - url: "http://prometheus-postgresql-adapter-default:9201/read" |
配置 Prometheus 数据存储至 Postgres
要将TimescaleDB和PostgreSQL连接到Prometheus,有两个组件:a. 的 Prometheus_PostgreSQL_Adapter b.具有pg_prometheus和timescaledb扩展名的PostgreSQL数据库
1.安装pg_prometheus:
- 在postgresql的postgresql.conf中添加:
shared_preload_libraries = 'pg_prometheus',重启psql - 使用psql创建扩展:
CREATE EXTENSION pg_prometheus; - 创建role:
CREATE ROLE admin WITH LOGIN PASSWORD 'admin'; - 授权role admin:
GRANT ALL ON SCHEMA prometheus TO admin; - 创建table:
SELECT create_prometheus_table('metrics');
2.安装prometheus-postgresql-adapter:
启动命令如下,需要注意的是,由于在容器内部运行,-pg.host必须指定postgresql主机的地址,而非loopback接口:
-pg-host\=pg-prometheus-default -pg-password\=123456 -pg-prometheus-log-samples # 连接pg数据库
配置集群外部服务接入,并监控访问流量 (Istio + Prometheus + Grafana)
安装 Istio
Istio.yam:l


# Gateway描述了在网格边缘运行的负载均衡器,用于接收传入或传出的HTTP / TCP连接
apiVersion: networking.istio.io/v1alpha3
kind: Gateway
metadata:
name: gateway-external-svcentry
spec:
selector:
istio: ingressgateway # use Istio default gateway implementation
servers:
- port:
number: 80
name: http
protocol: HTTP
hosts:
- external.with.svcentry

---
# VirtualService定义了一组寻址主机时要应用的流量路由规则
apiVersion: networking.istio.io/v1alpha3
kind: VirtualService
metadata:
name: vs-external-svcentry
spec:
hosts:
- external.with.svcentry
gateways:
- gateway-external-svcentry
http:
- match:
- uri:
prefix: /
route:
- destination:
port:
number: 80
host: google-external-svcentry.service-pro.svc.cluster.local


---

apiVersion: v1
kind: Service
metadata:
name: google-external-svcentry
spec:
ports:
- name: http-8205
port: 80
protocol: TCP
targetPort: 8205
sessionAffinity: None
type: ClusterIP
status:
loadBalancer: {}

---

apiVersion: networking.istio.io/v1alpha3
kind: ServiceEntry
metadata:
generation: 1
name: se-external-svcentry
spec:
endpoints:
- address: 10.8.1.157  #接入外部服务IP
labels: {}
hosts:
- google-external-svcentry.service-pro.svc.cluster.local
ports:
- name: http-8205
number: 8205  #外部服务端口
protocol: HTTP
resolution: STATIC |
安装 Grafana
Grafana接入promethues图表显示,
Grafana接入pgsql进行图表展示。
配置 Prometheus 抓取 Istio 访问请求
mixer组件中遥测相关的对外提供的Kubernetes的Service的服务名是istio-telemetry,mixer对外开放的exporter的数据查询接口是/metrics;
- job_name: dx-servicemesh static_configs: - targets: - istio-telemetry.istio-system:42422 |
Istio 接入外部服务
开放服务的IP和端口,接入istio服务。(这边开放了一个Google的IP和端口:10.7.122.10:30025)
apiVersion: networking.istio.io/v1alpha3
kind: ServiceEntry
metadata:
generation: 1
name: se-external-svcentry
spec:
endpoints:
- address: 10.7.122.10  #接入外部服务IP
labels: {}
hosts:
- google-external-svcentry.service-pro.svc.cluster.local
ports:
- name: http-8205
number: 30025  #外部服务端口
protocol: HTTP
resolution: STATIC |
自己搭建的一个小demo:
1.	pg查询Google翻译istio_requests_total:

	连接pg数据库:
	命令: psql -U postgres -h 10.7.122.10 -p 30018 -d postgres

	password:123456

	查询语句:

	SELECT time, name, value, labels FROM metrics WHERE name = 'istio_requests_total' AND time >= '2020-01-03T09:54:53Z' AND time <= '2020-02-03T10:59:53Z'  AND labels @> '{"destination_service":"google-external-svcentry.service-pro.svc.cluster.local","monitor":"codelab-monitor"}' ORDER BY time \g


2.  promethues:http://10.7.122.10:30008/graph

	PromQL:istio_requests_total{destination_service="google-external-svcentry.service-pro.svc.cluster.local"}


3. Grafana: http://10.7.122.10:31234/dashboard/new?tab=queries&panelId=2&edit&fullscreen&orgId=1

	user: admin
	password:admin
Metrics:istio_requests_total{destination_service="google-external-svcentry.service-pro.svc.cluster.local"} |