步骤一:安装prometheus
$ brew install prometheus
可能会报错(没有权限):
Error: The following directories are not writable by your user:
/usr/local/lib/pkgconfig
$ sudo chown -R $(whoami) /usr/local/lib/pkgconfig
$ chmod u+w /usr/local/lib/pkgconfig
步骤二:编写配置文件 prometheus.yml
vim /usr/local/etc/prometheus.yml
global:
  scrape_interval: 15s

scrape_configs:
  - job_name: "prometheus"
    static_configs:
    - targets: ["localhost:9090"]
步骤三:后台运行(&)prometheus
$ prometheus --config.file=/usr/local/etc/prometheus.yml &
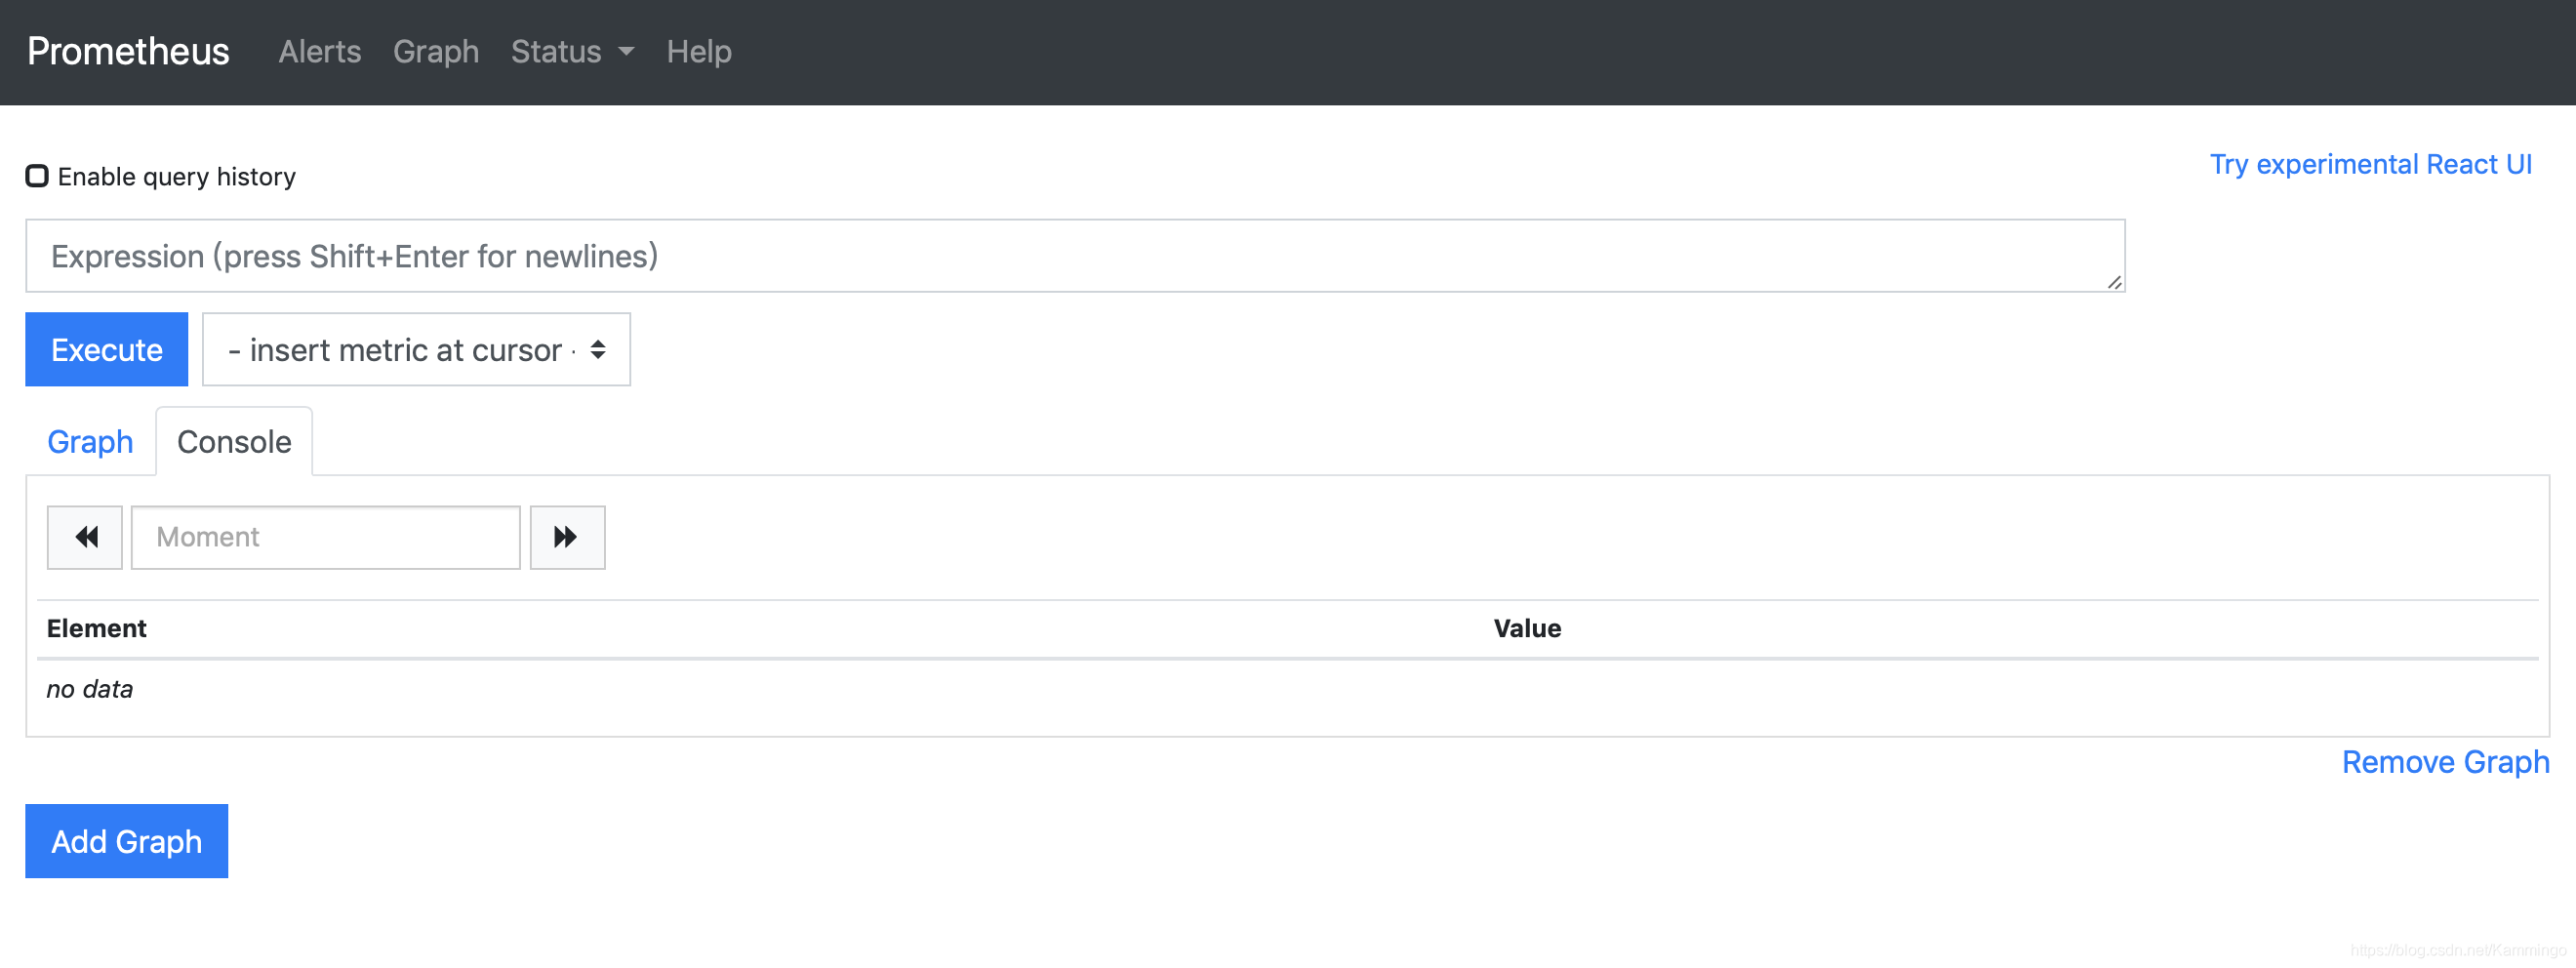
浏览器访问localhost:9090就可以看到prometheus的监控页面
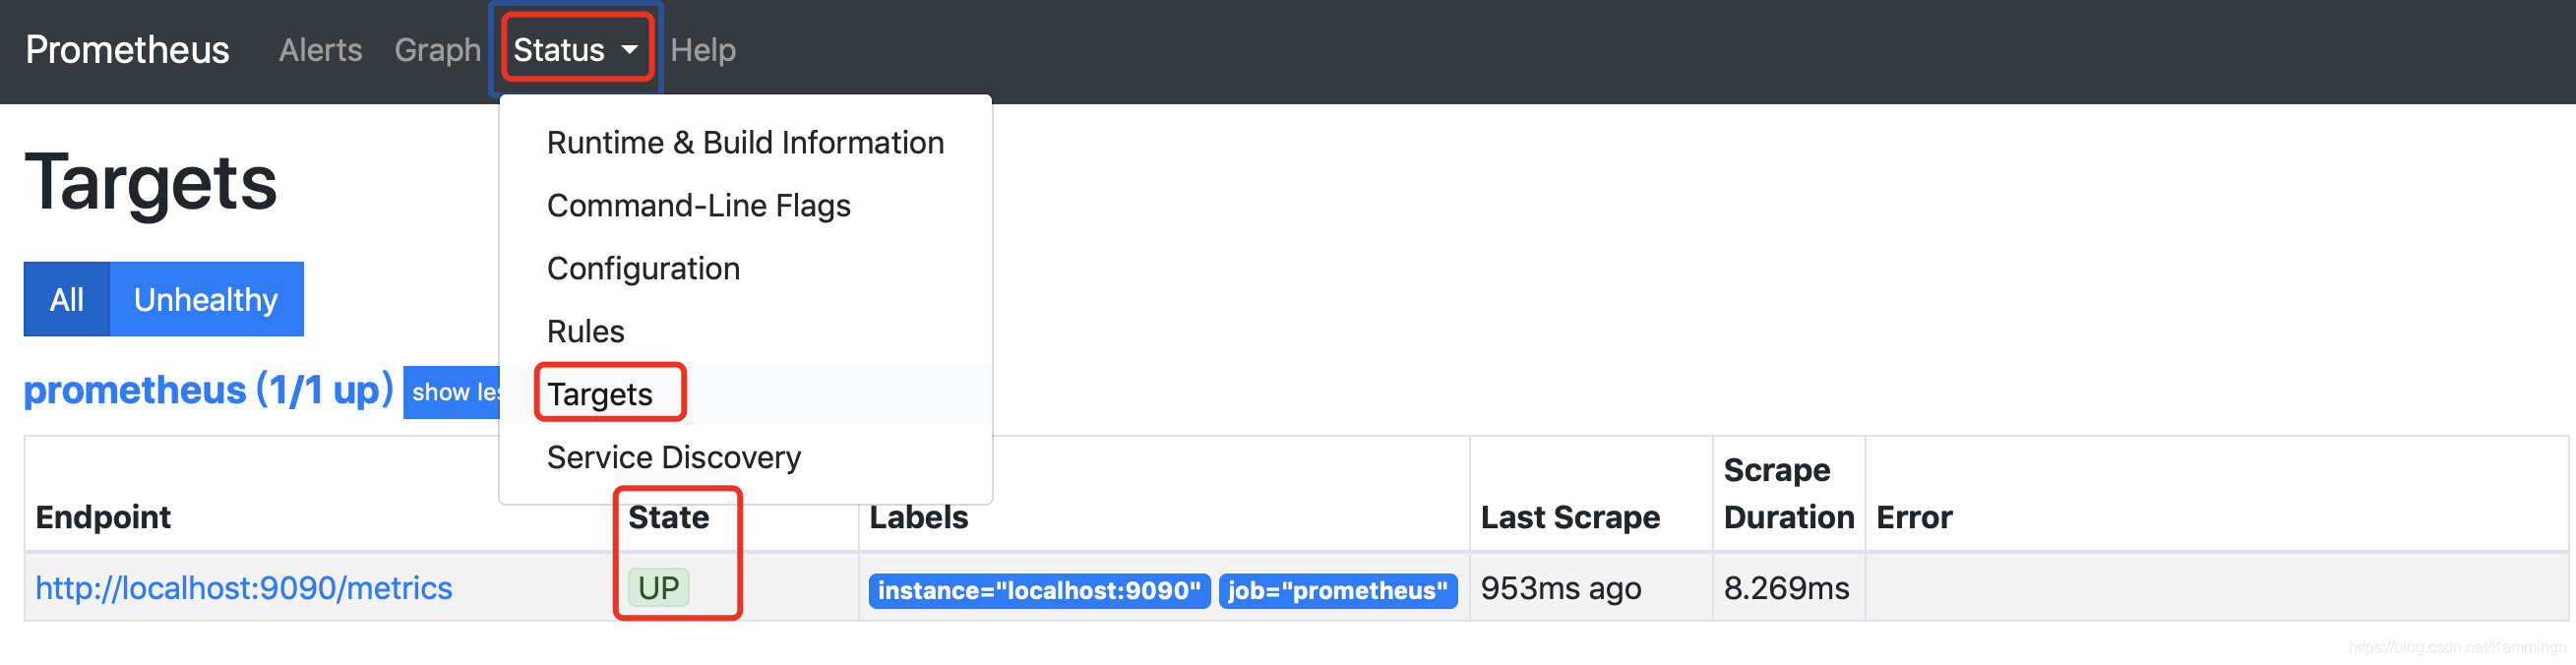
targets能看到被监控主机状态
步骤四:安装Grafana
$ brew install grafana
步骤五:运行Grafana
$ brew services start grafana
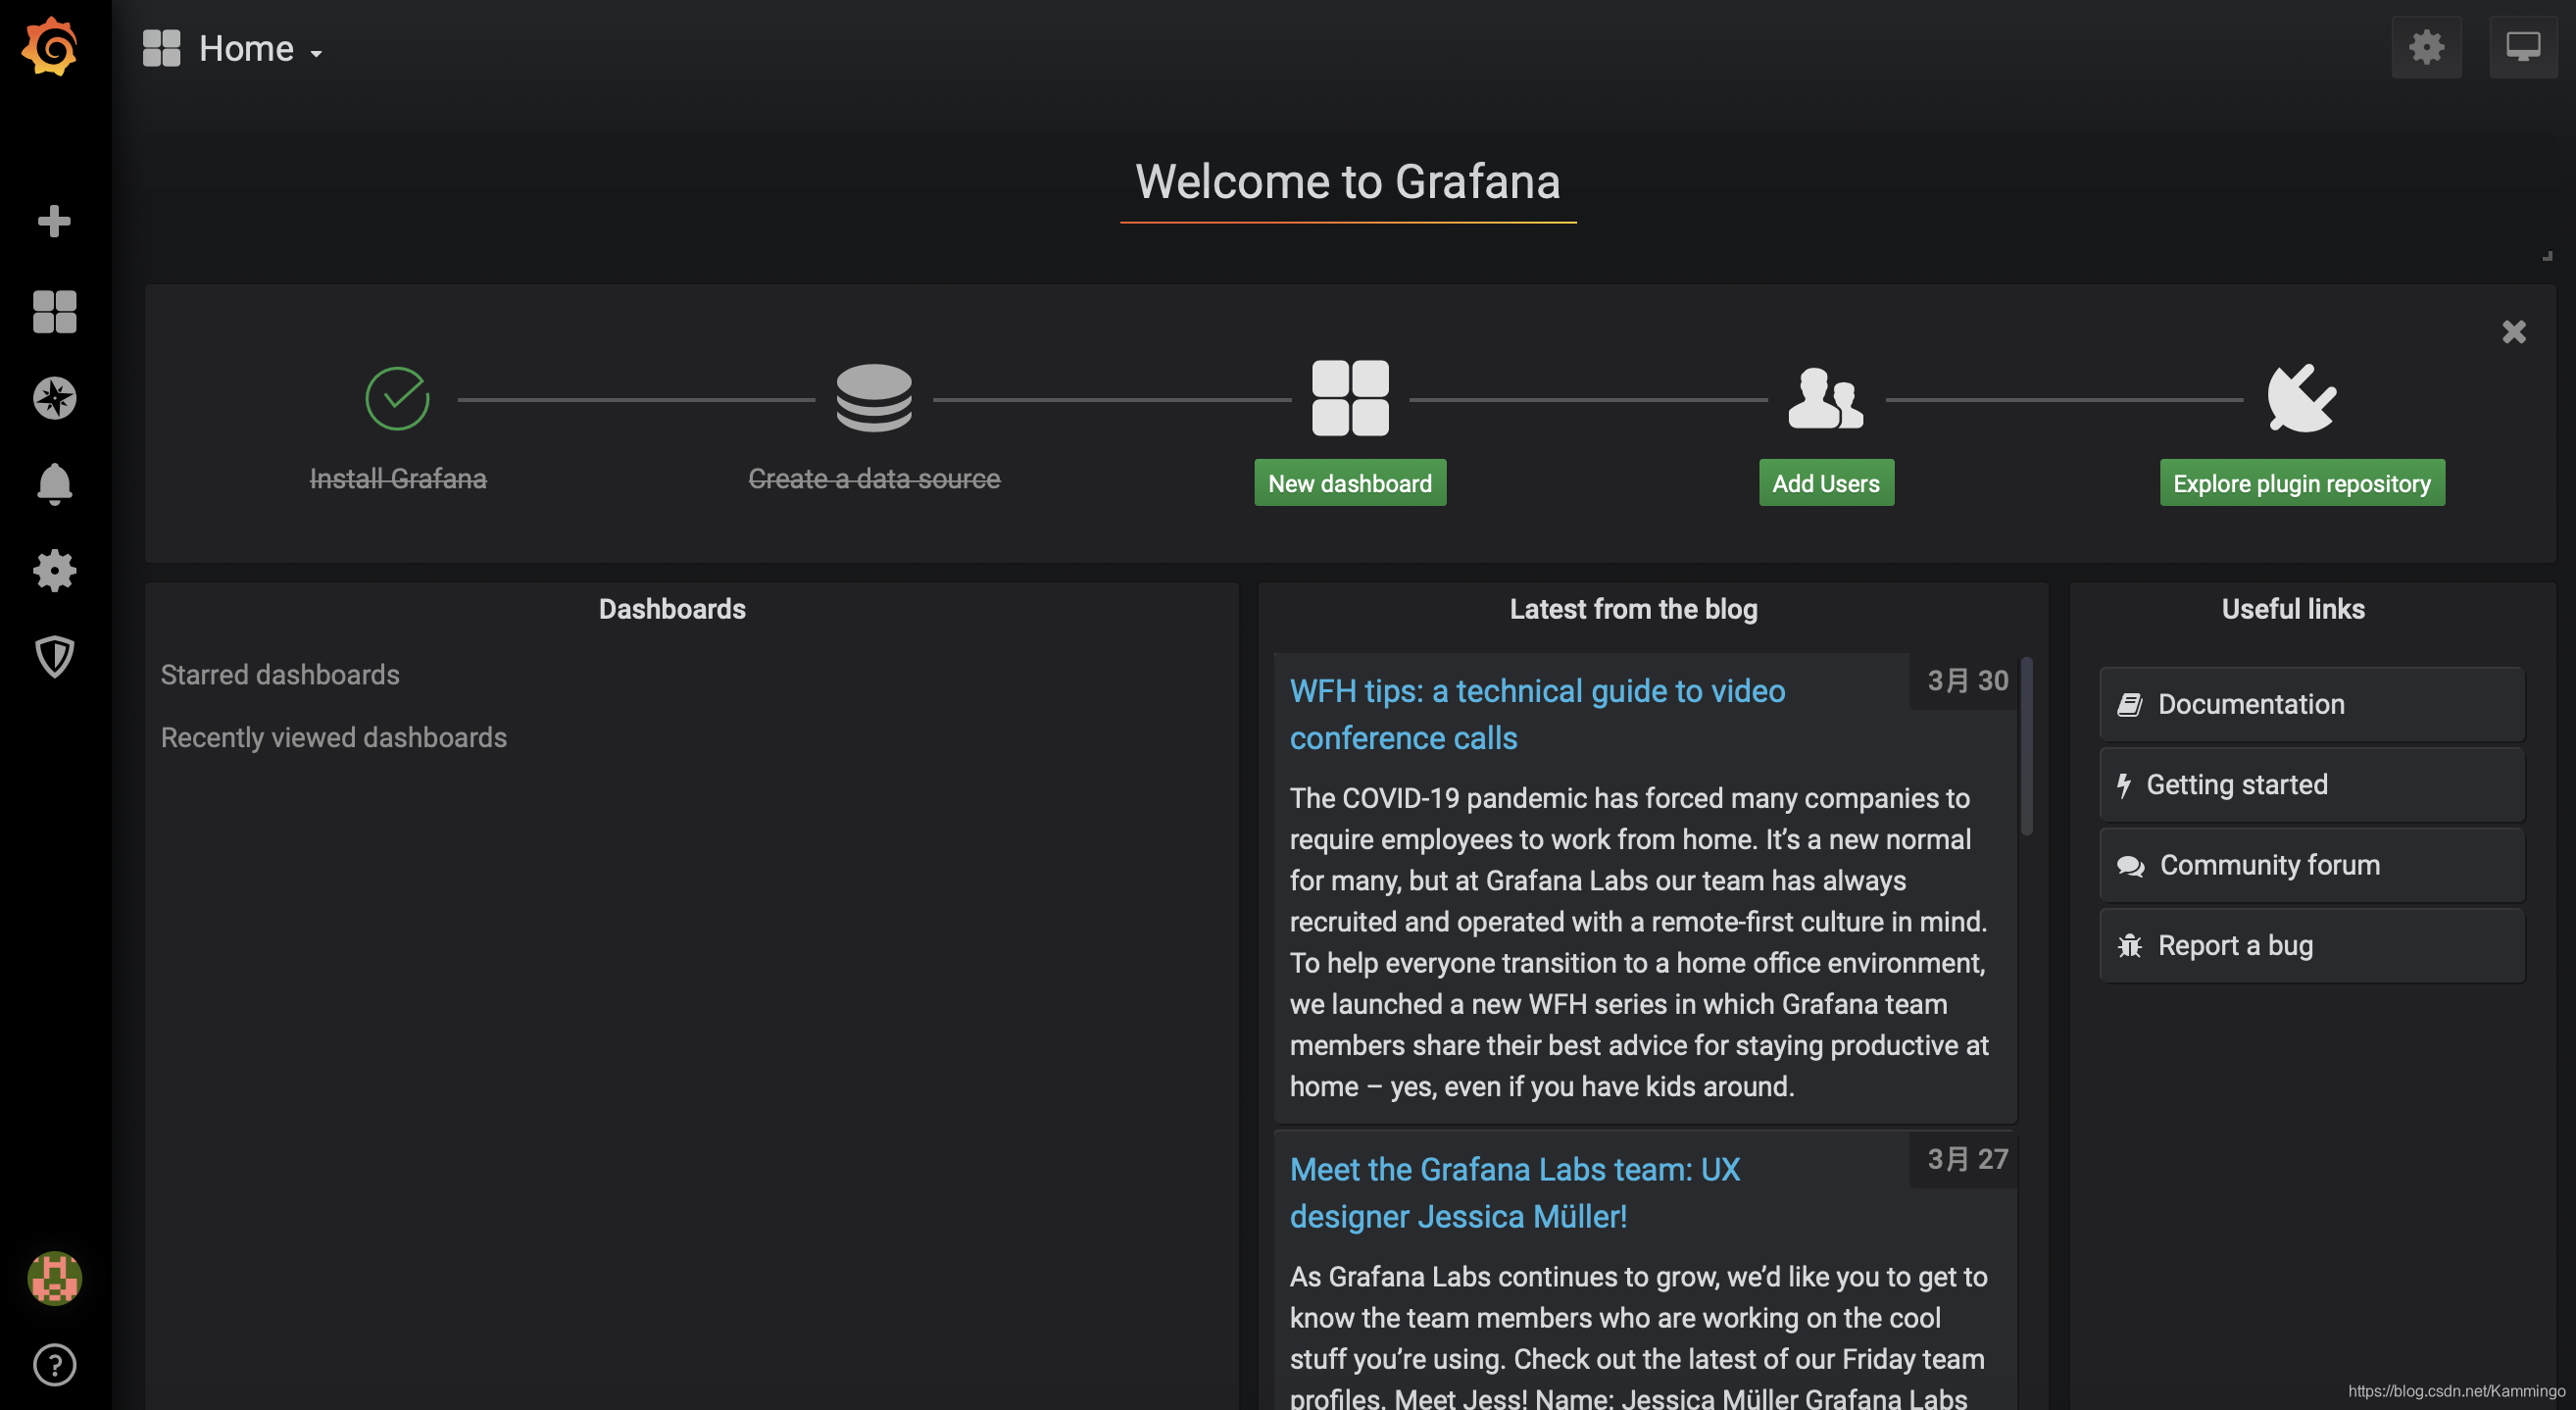
浏览器访问http://localhost:3000就可以看到Grafana页面
步骤六:创建数据图形
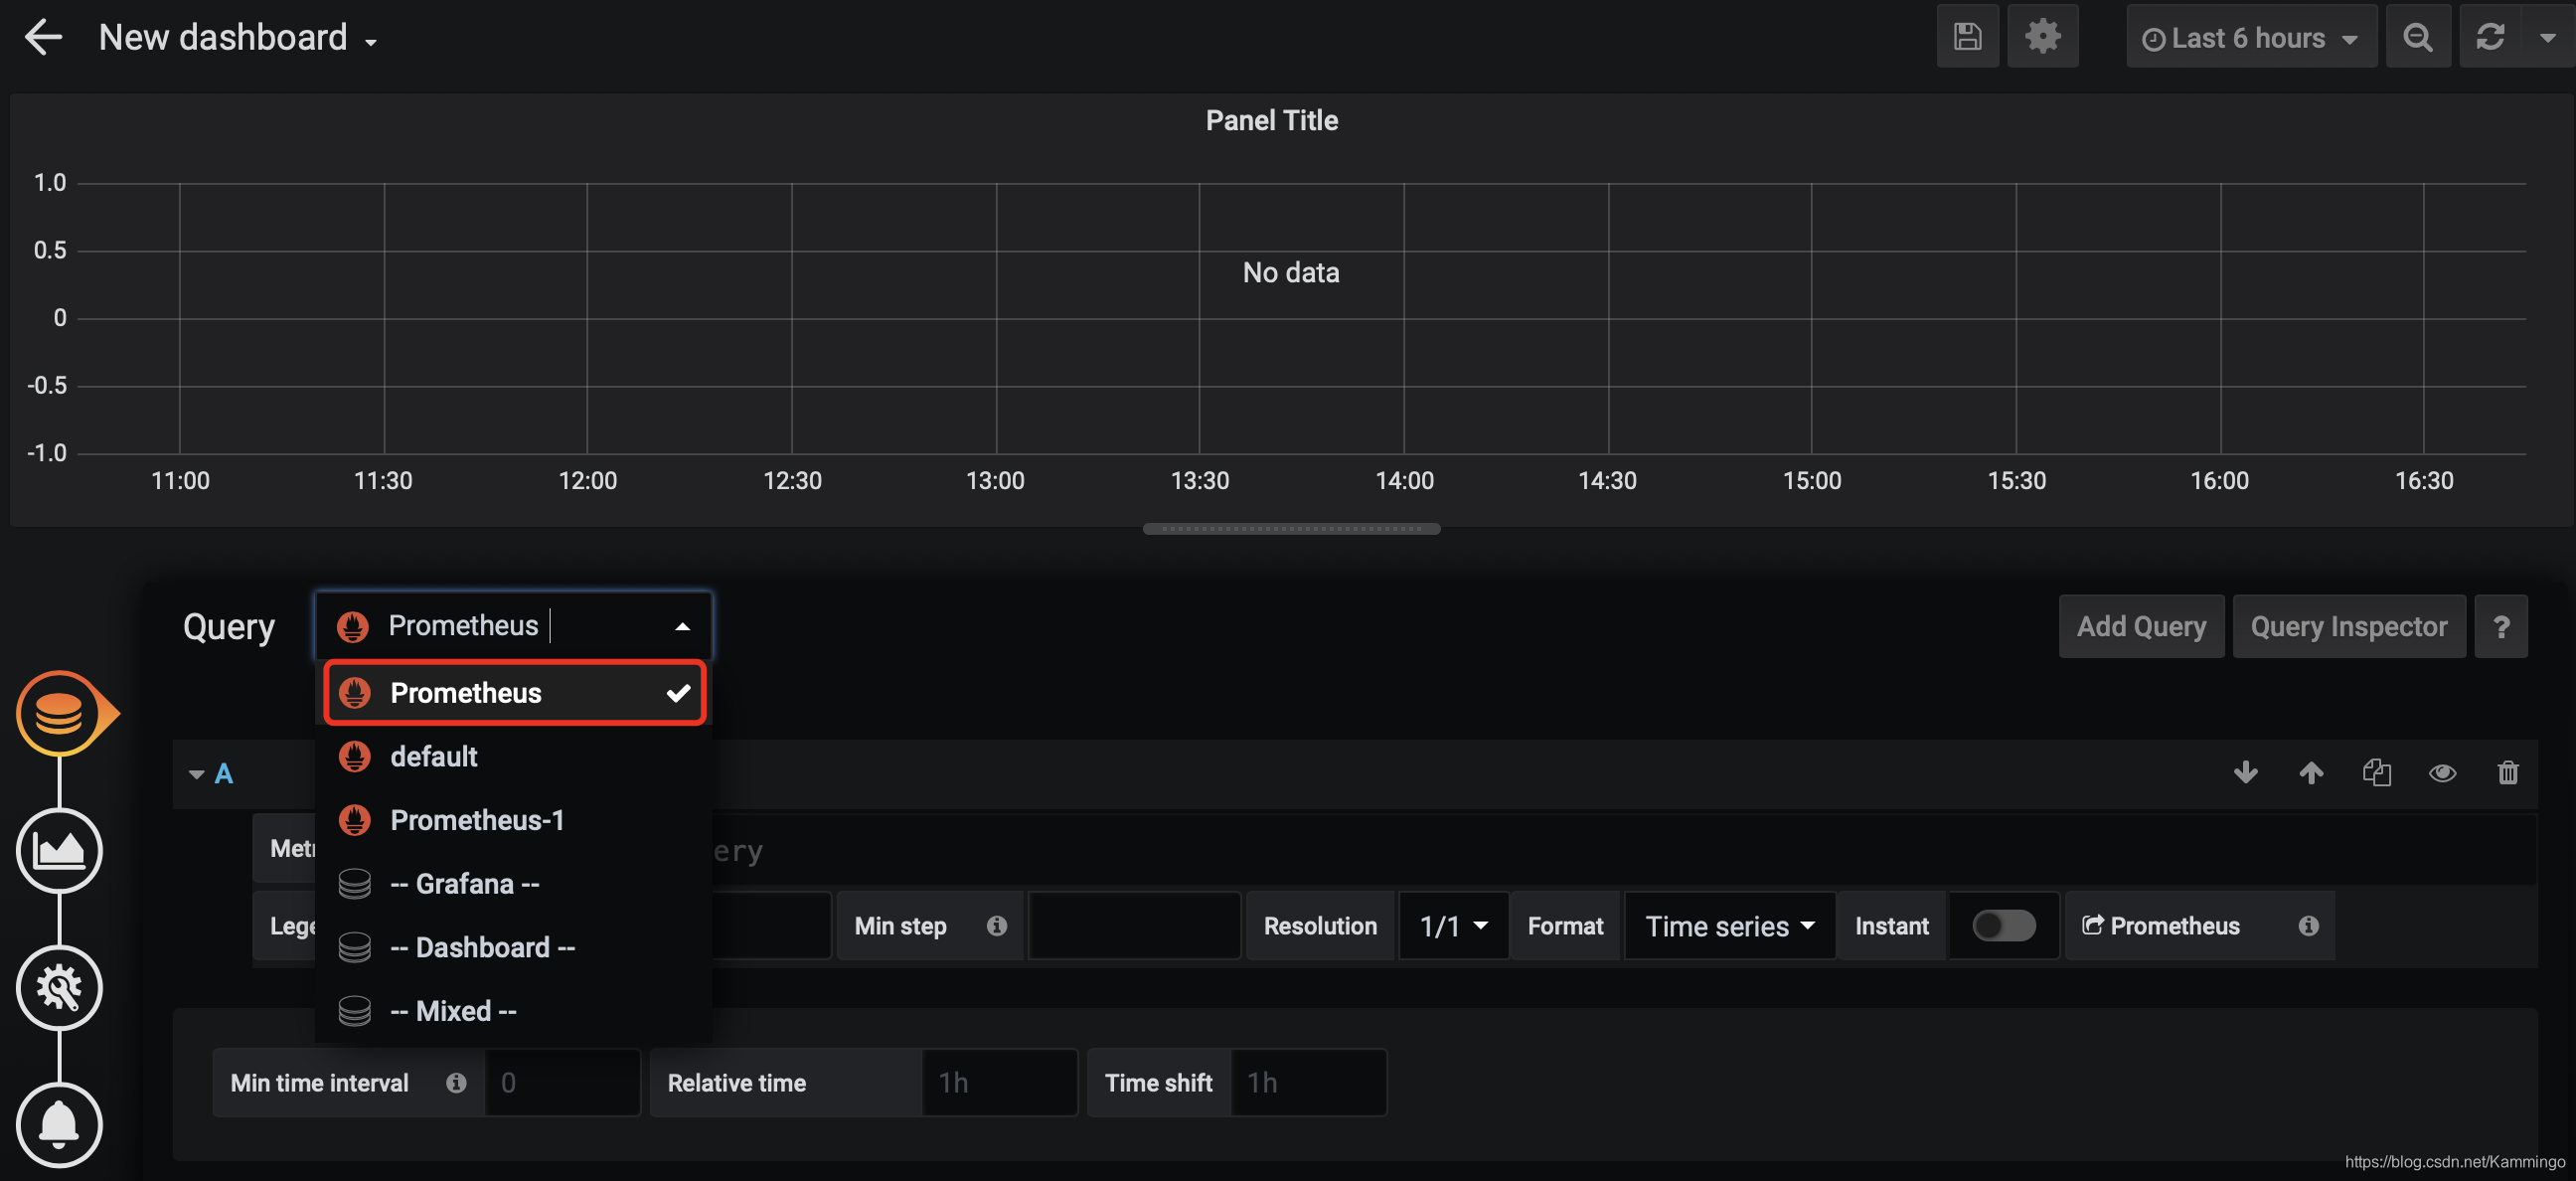
选择监控数据来源
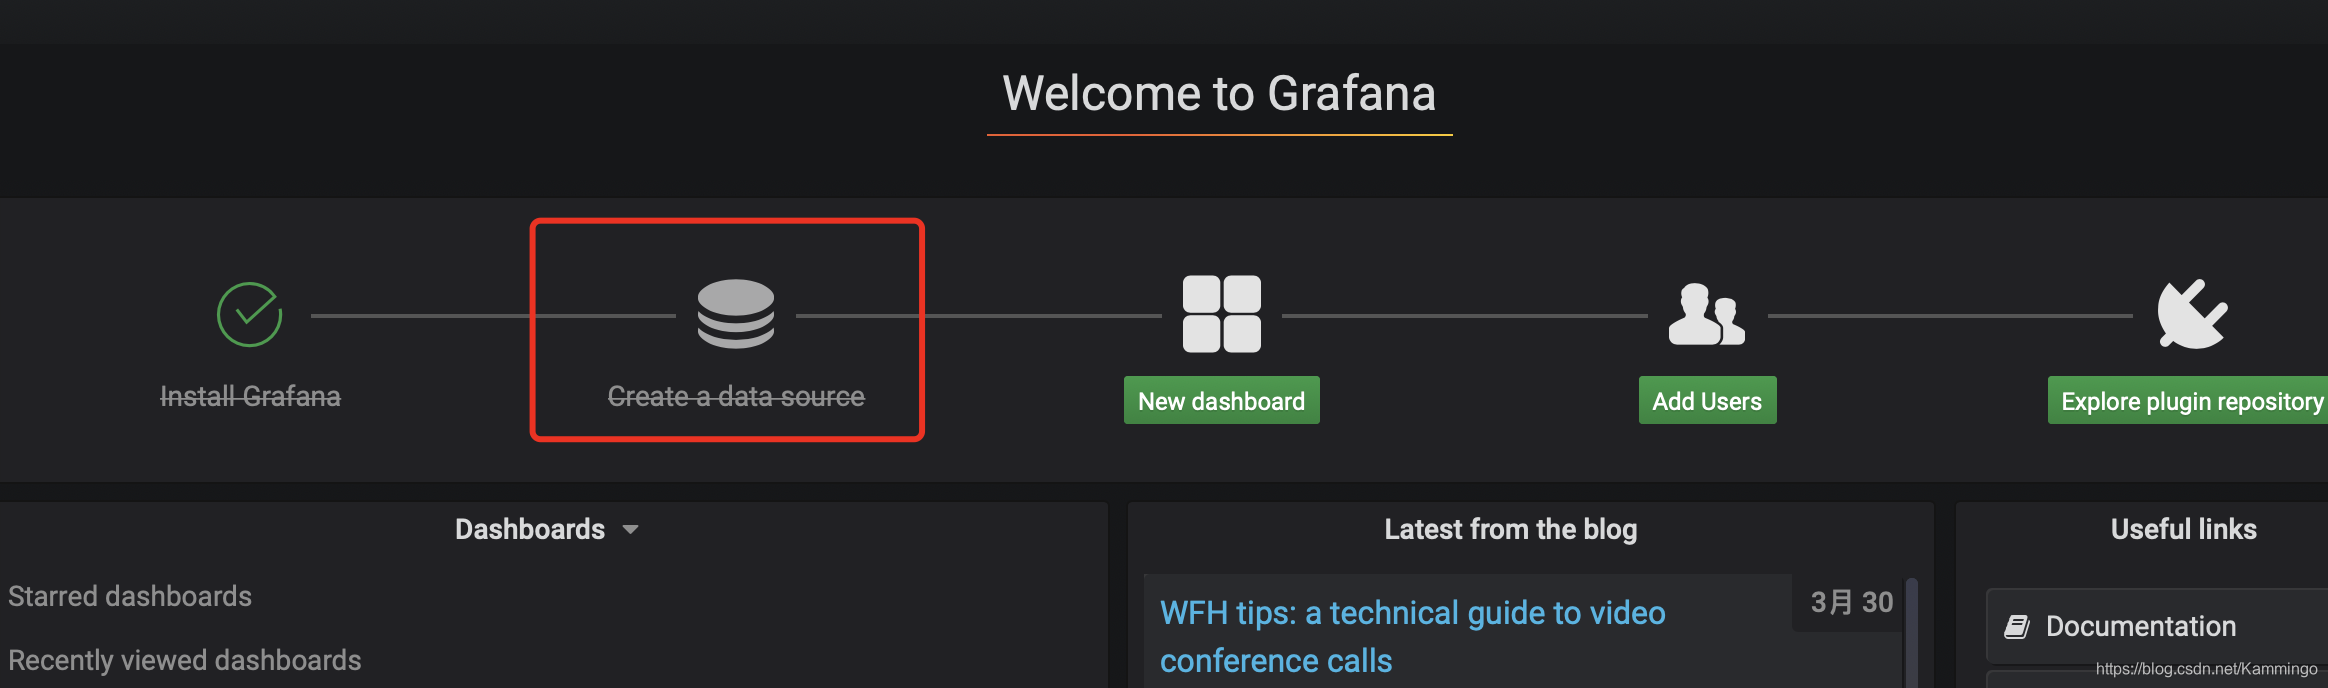
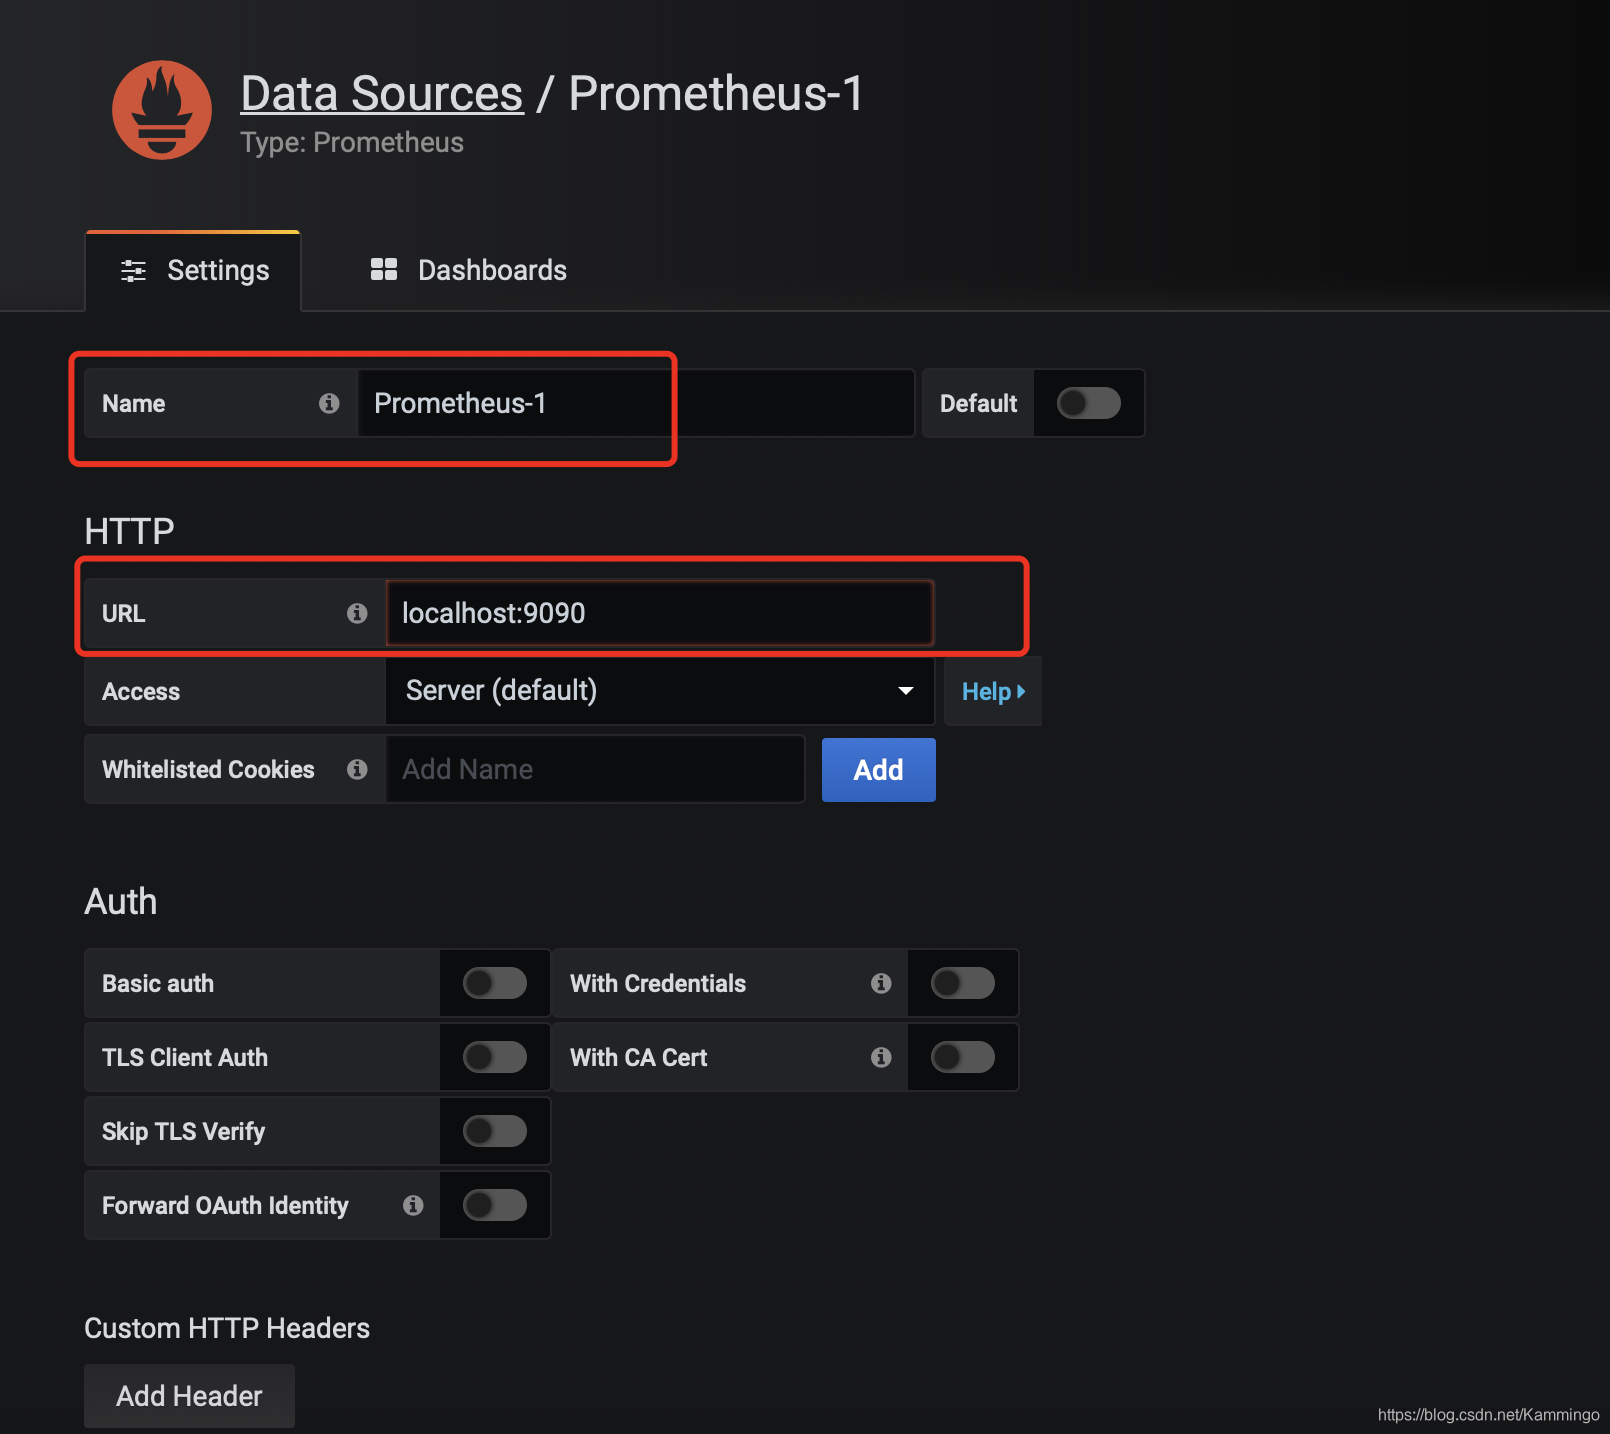
这里创建的是prometheus
定义监控名、url
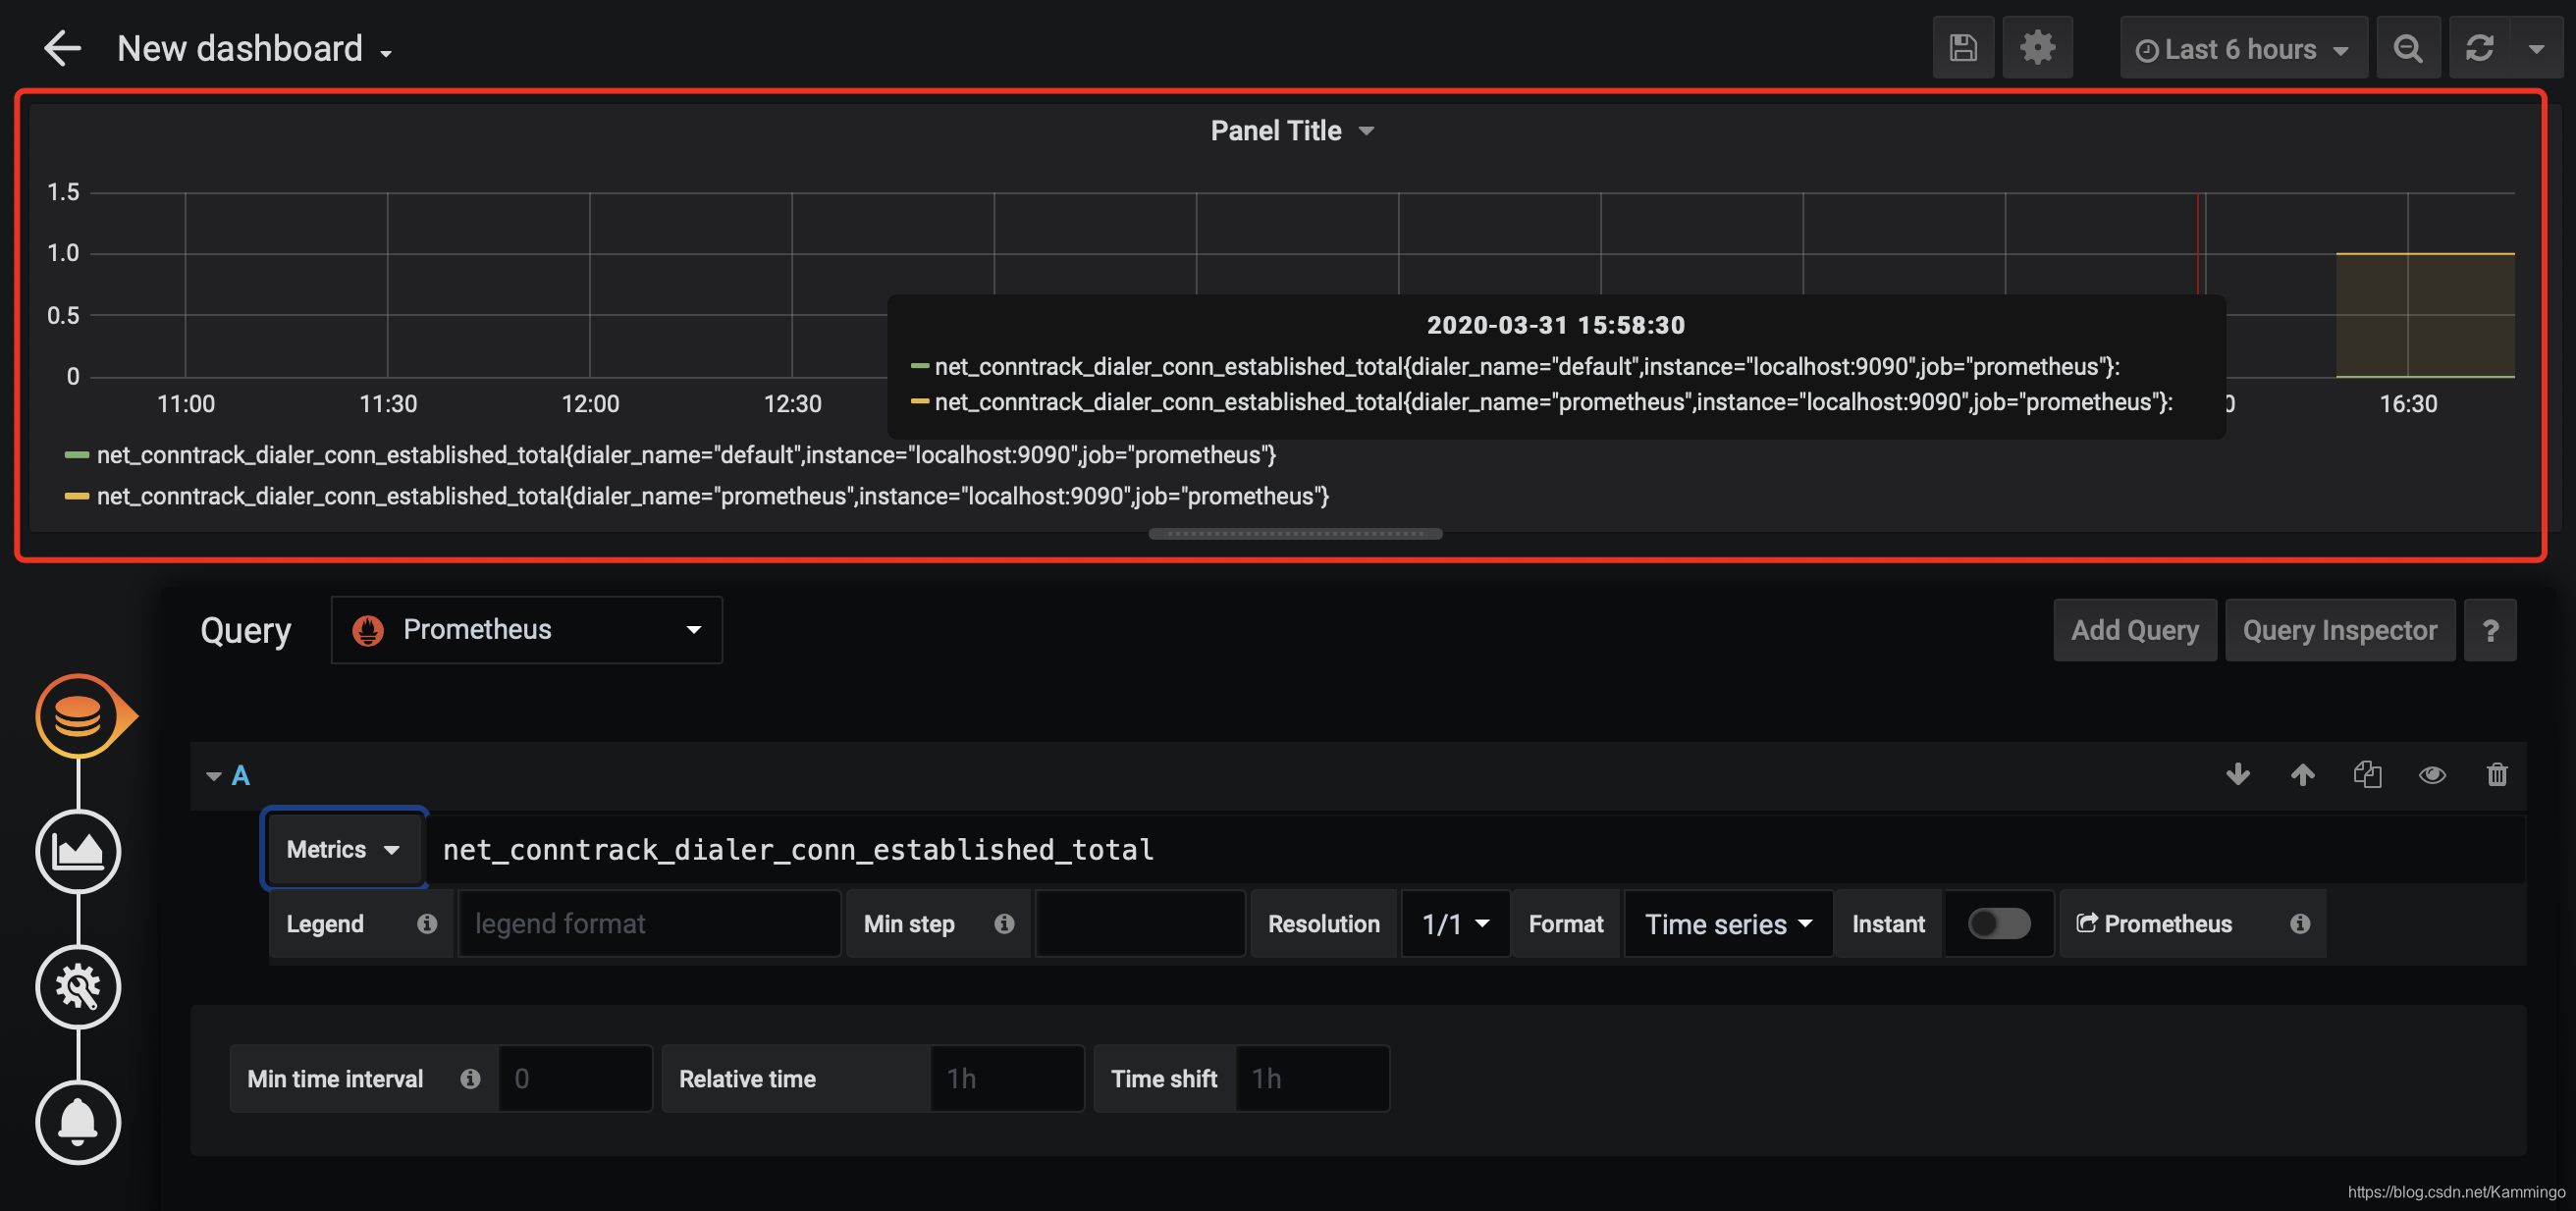
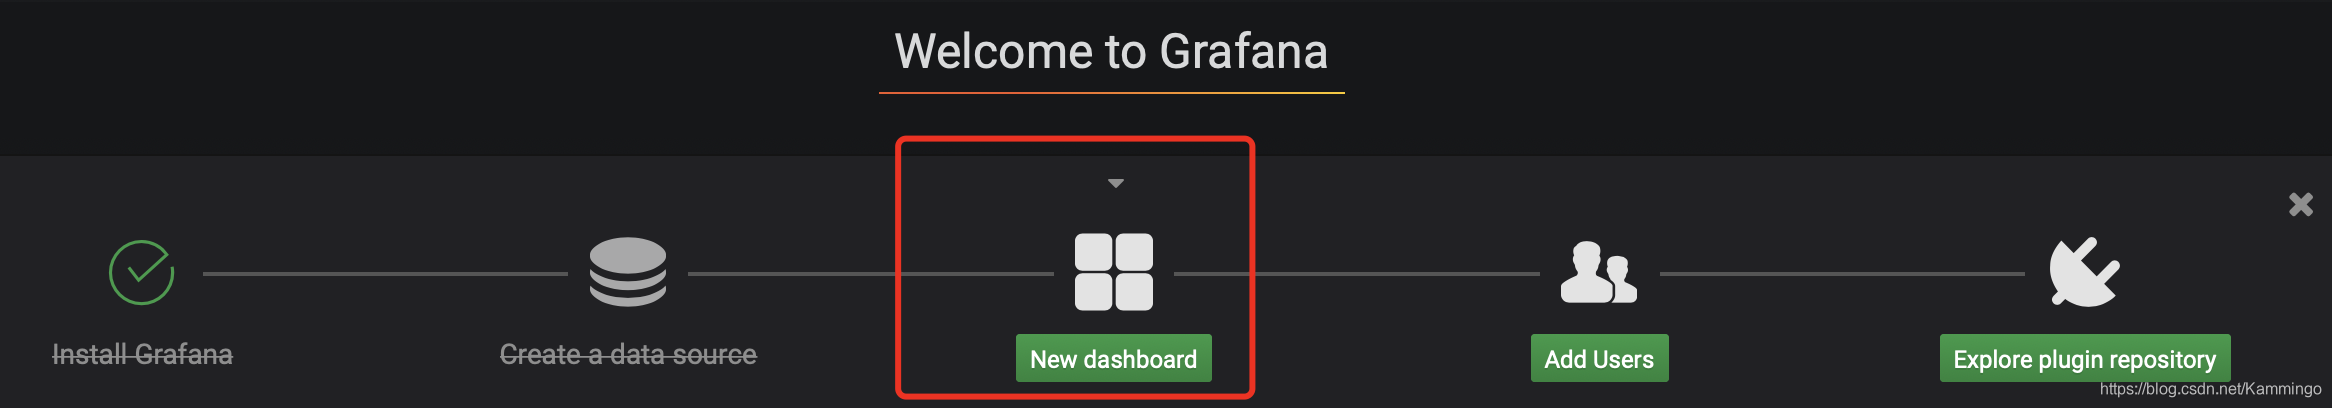
添加图形
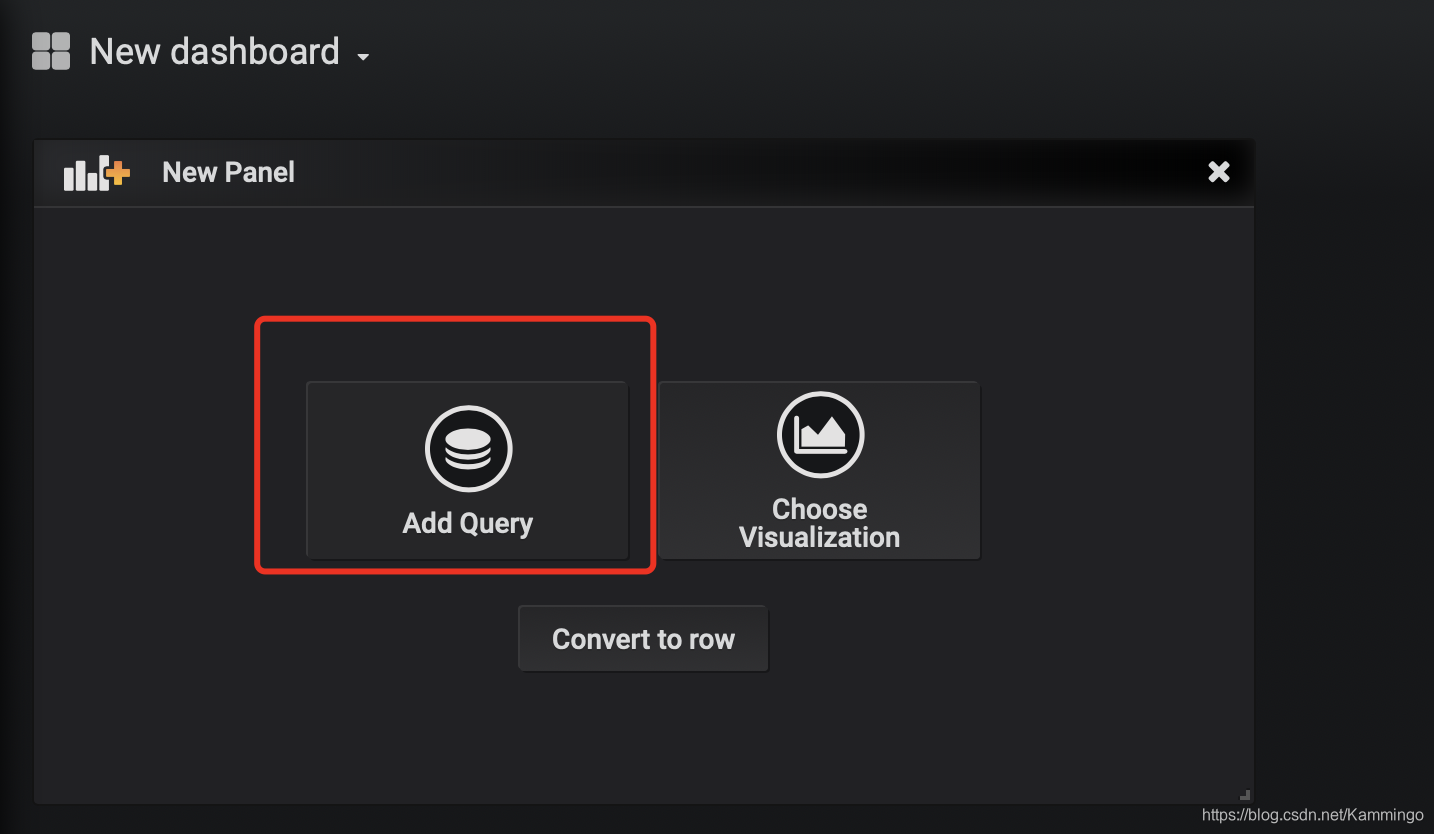
选择被监控名
选择监控项
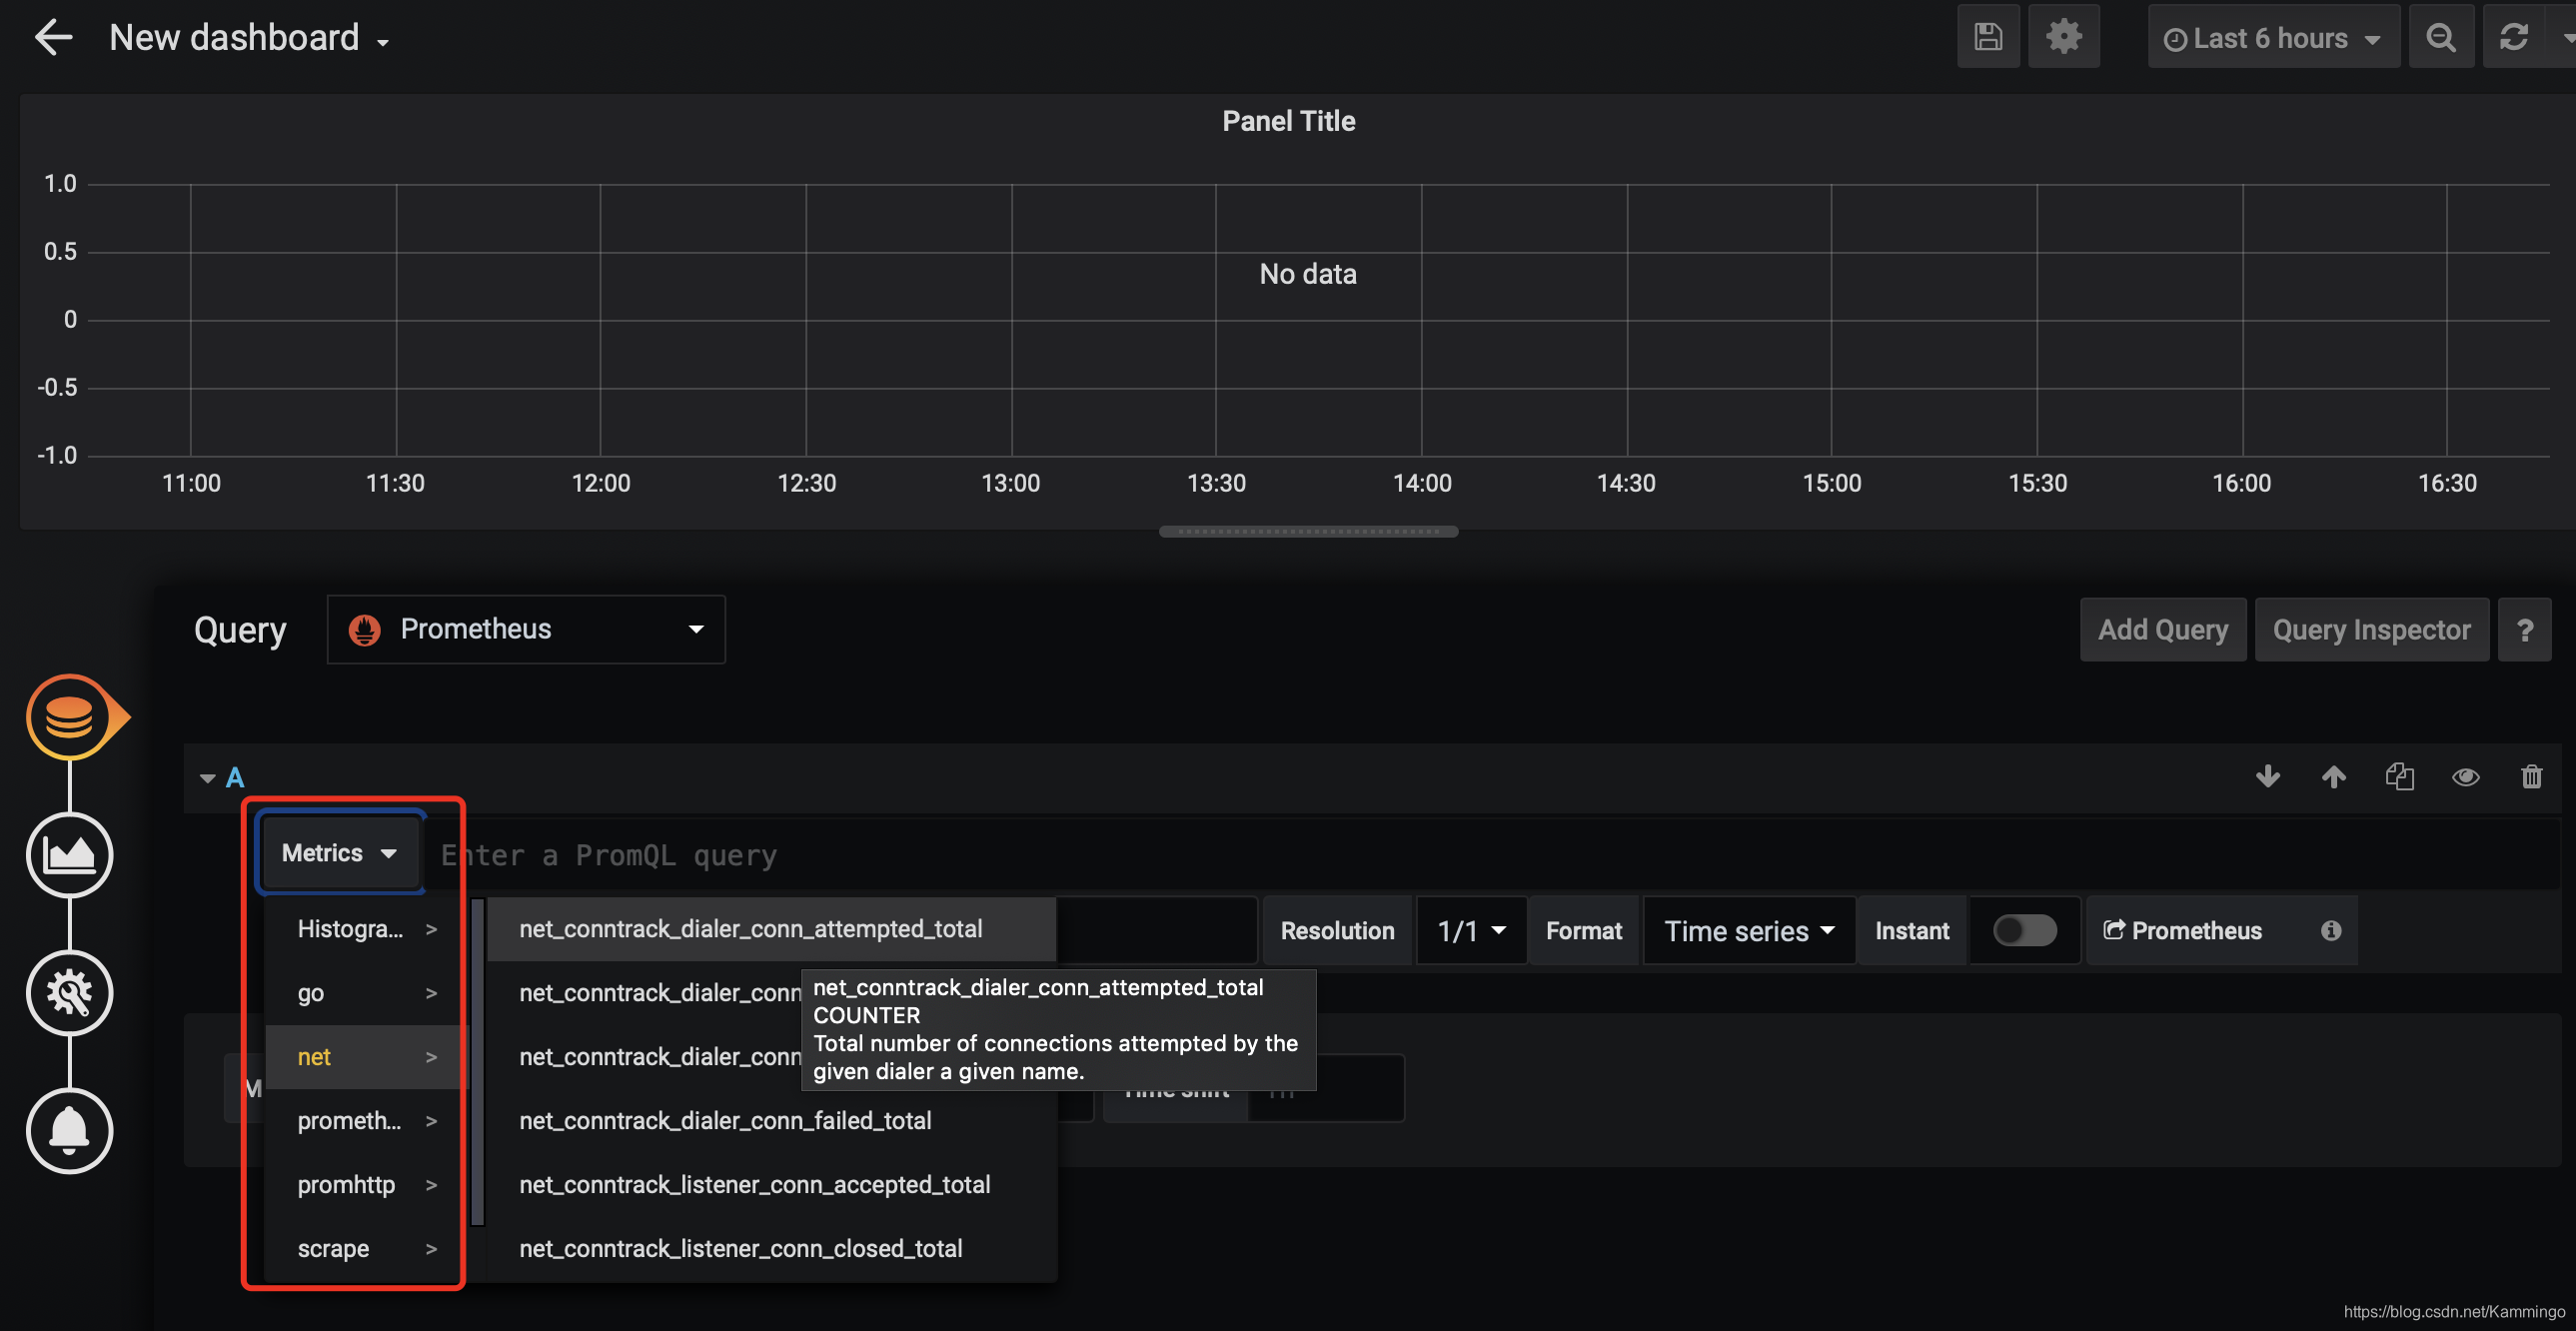
展示监控数据