机器 : 172.27.143.155 【grafana+Prometheus】
一、Prometheus安装:
1、wget https://github.com/prometheus/prometheus/releases/download/v2.8.1/prometheus-2.8.1.linux-amd64.tar.gz
2、tar -zxvf prometheus-2.8.1.linux-amd64.tar.gz -C /usr/local/
3、cd /usr/local
4、mv prometheus-2.8.1.linux-amd64/ prometheus
5、cd prometheus/
6、查看版本
./prometheus --version
7、修改配置文件
prometheus.yml 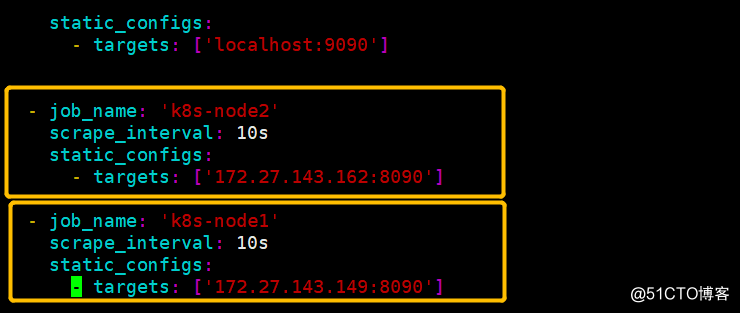
8、完成之后做成service服务
vim /lib/systemd/system/prometheus.service
[Unit]
Description=Prometheus
Documentation=https://prometheus.io/
After=network.target
[Service]
Type=simple
User=root
ExecStart=/usr/local/prometheus/prometheus --config.file=/usr/local/prometheus/prometheus.yml --storage.tsdb.path=/home/software/prometheus-data
Restart=on-failure
[Install]
WantedBy=multi-user.target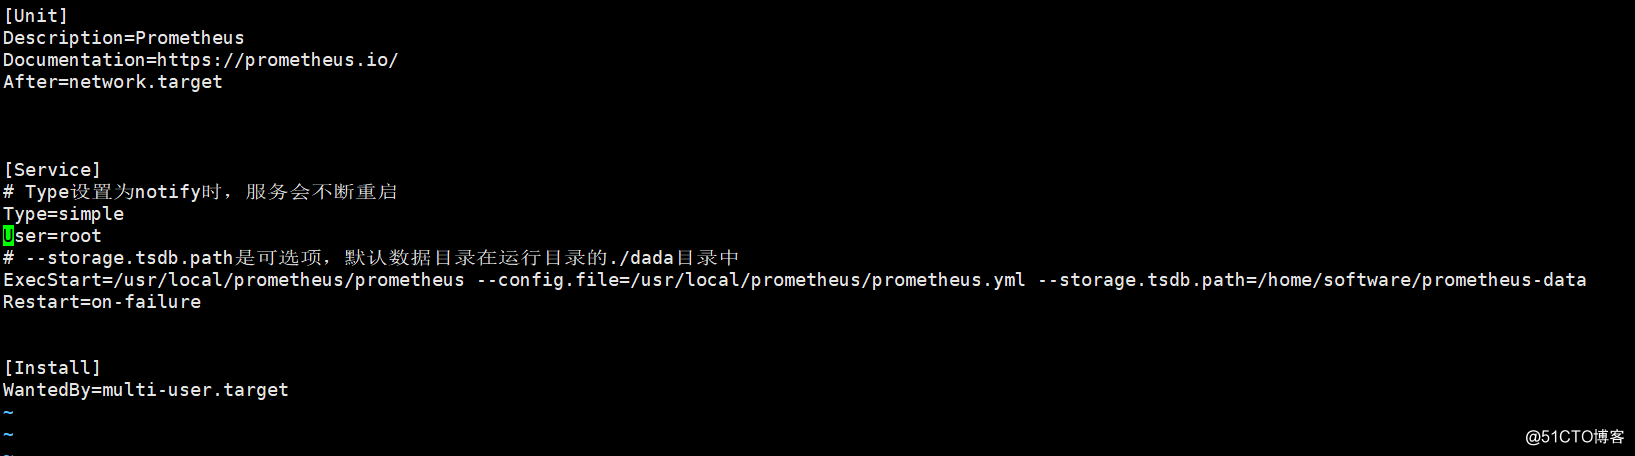
然后启动就可以了
然后验证
systemctl start prometheus
http://172.27.143.155:9090/targets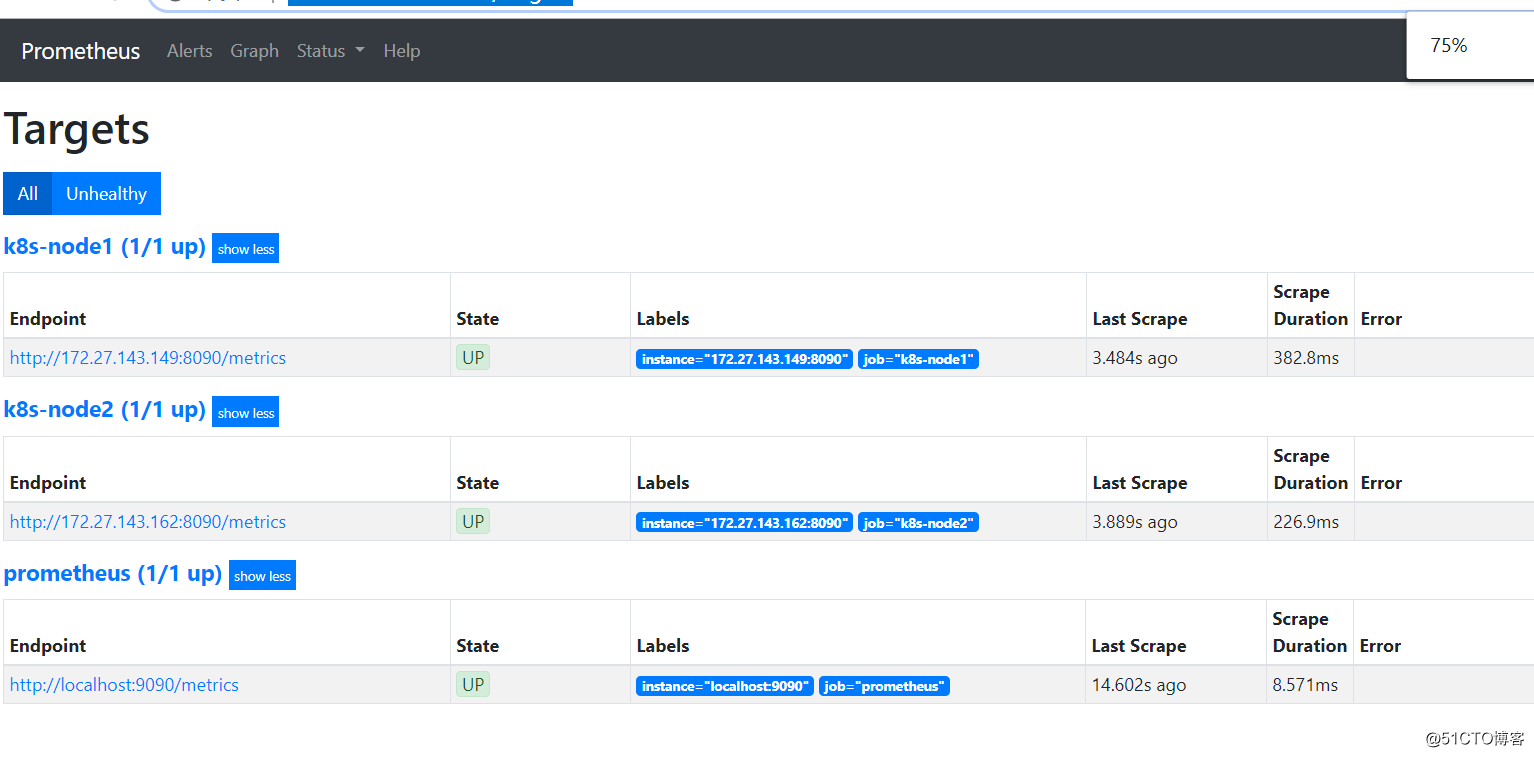
二、安装grafana
1、https://grafana.com/grafana/download
2、wget https://dl.grafana.com/oss/release/grafana-6.5.2.linux-amd64.tar.gz
3、tar -zxvf grafana-6.5.2.linux-amd64.tar.gz
4、mv grafana-6.5.2 /usr/local/grafana
5、cd /usr/local/grafana/bin
6、nohup ./grafana-server &
http://172.27.143.155:3000/
账号和密码默认都是admin
7、配置数据源,这里时Prometheus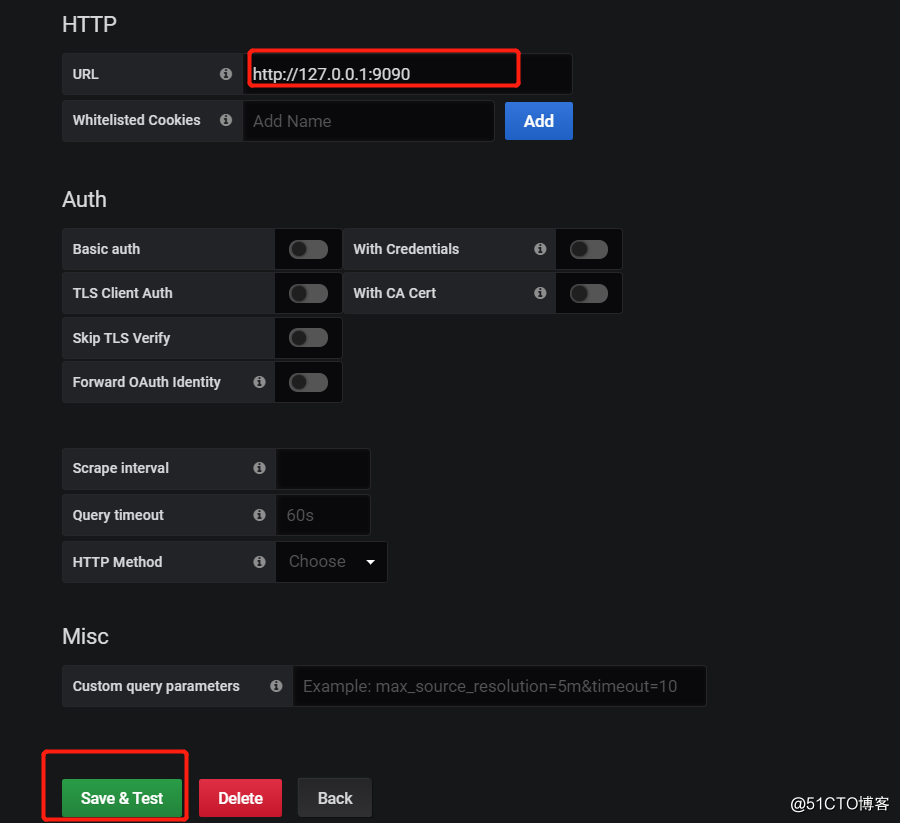
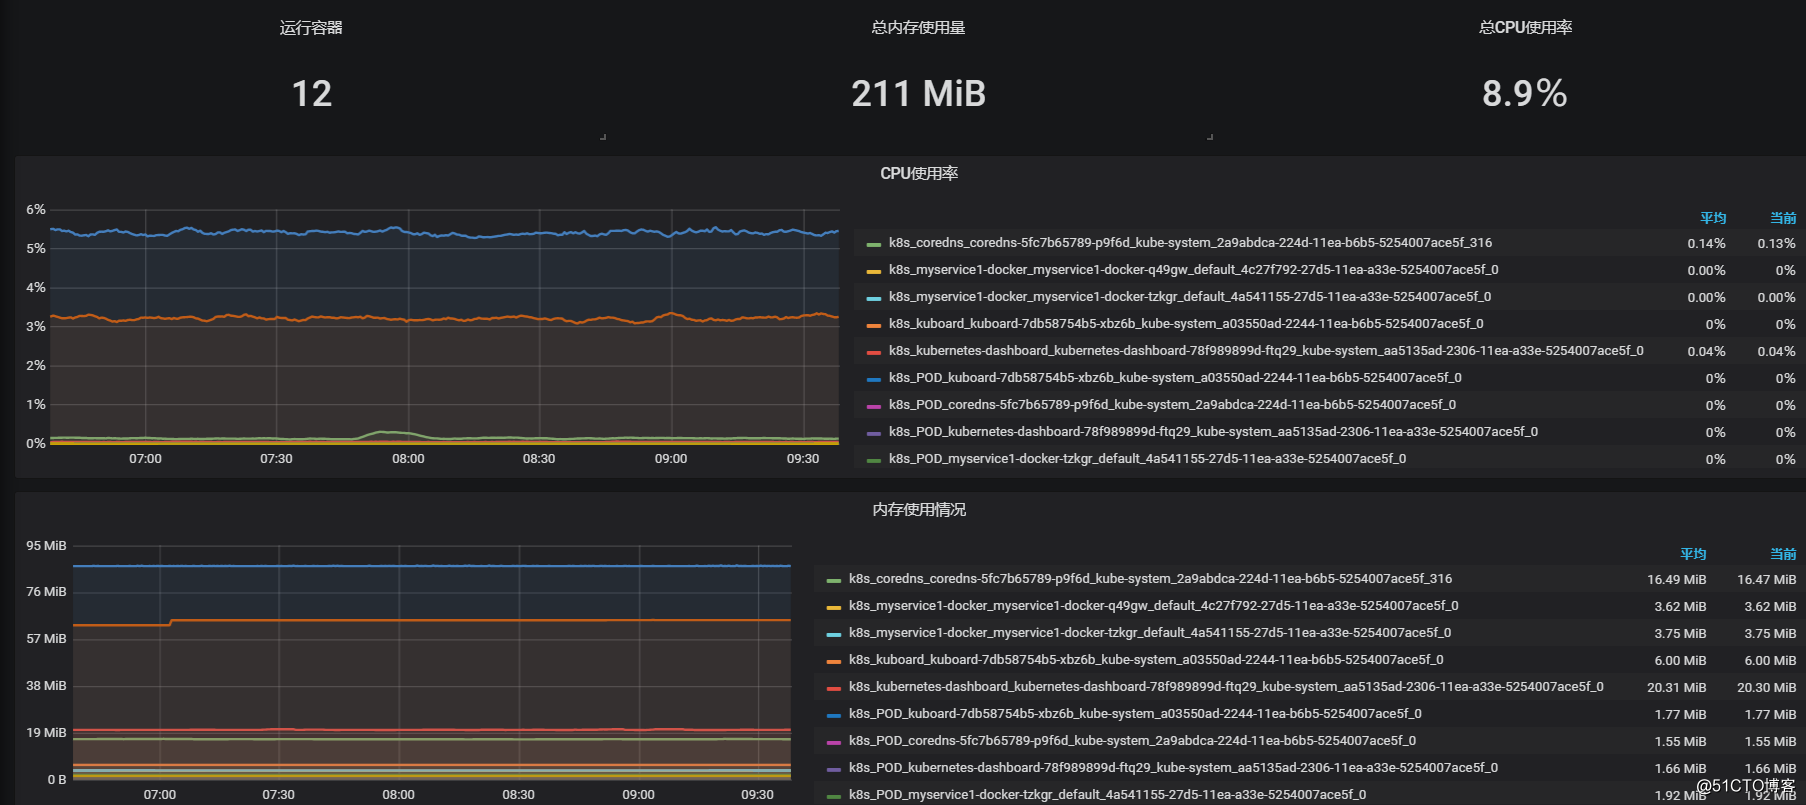
8、导入模板ID号时193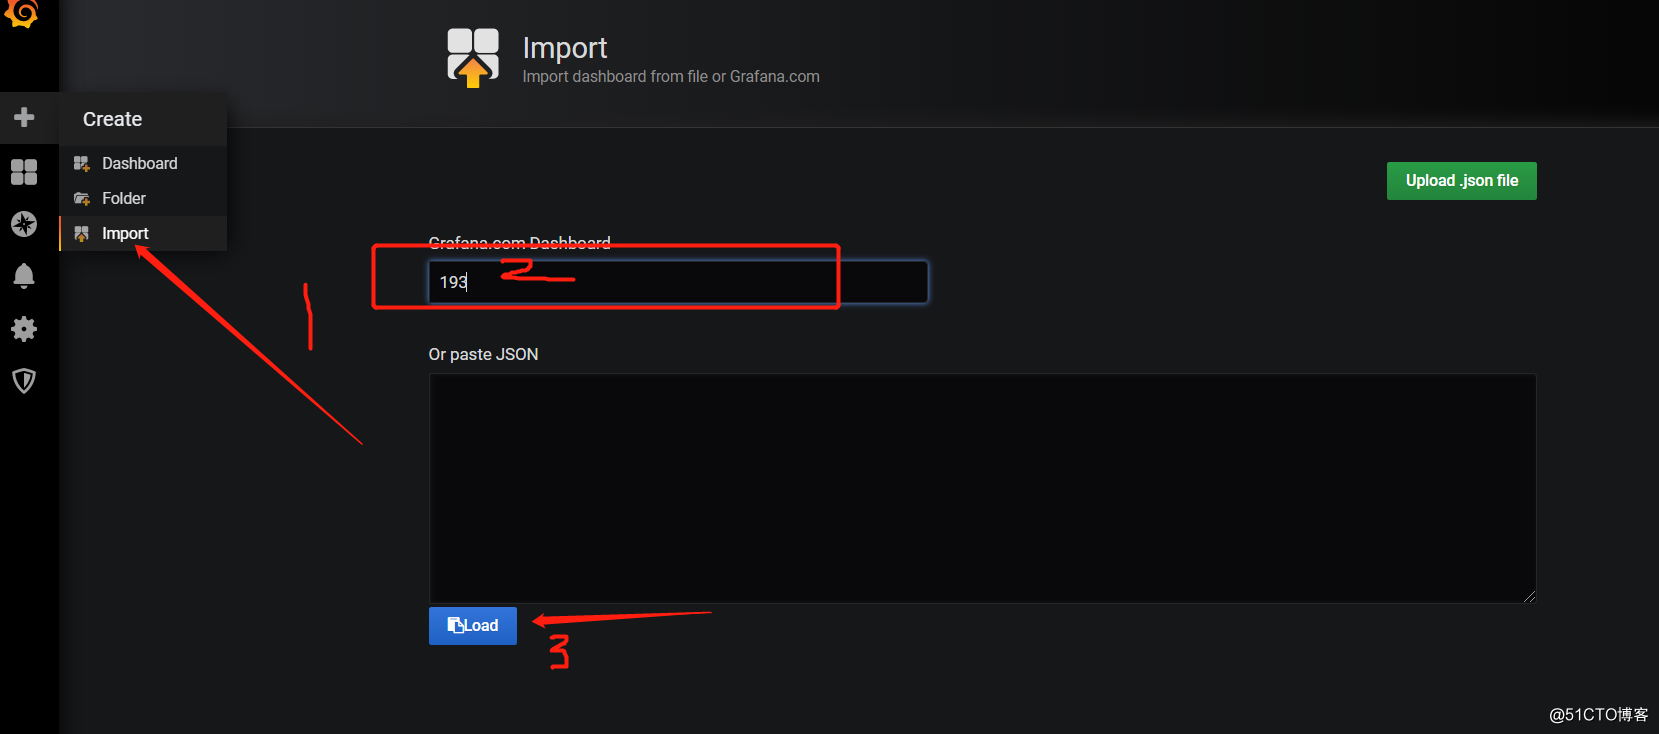
9、完成之后可以查看效果