背景:
k8s集群部署后,急需可靠稳定低延时的集群监控报警系统,报警k8s集群正常有序运行,经过不断调研和测试,最终选择Prometheus+AlertManager+Grafana+prometheusAlert的部署方案,故障信息报警至钉钉群和邮件,如需要额外监控可部署pushgateway主动推送数据到Prometheus进行数据采集
部署方案:
Prometheus+AlertManager+Grafana+prometheusAlert+Dingding(可自行部署pushgateway)
前提:
k8s集群已经部署完毕,详细见使用 kubeadm 搭建生产环境的单 master 节点 k8s 集群
部署
一、 Prometheus部署
Prometheus 由多个组件组成,但是其中有些组件是可选的:
Prometheus Server:用于抓取指标、存储时间序列数据
exporter:暴露指标让任务来抓
pushgateway:push 的方式将指标数据推送到该网关
alertmanager:处理报警的报警组件 adhoc:用于数据查询
Prometheus架构图:
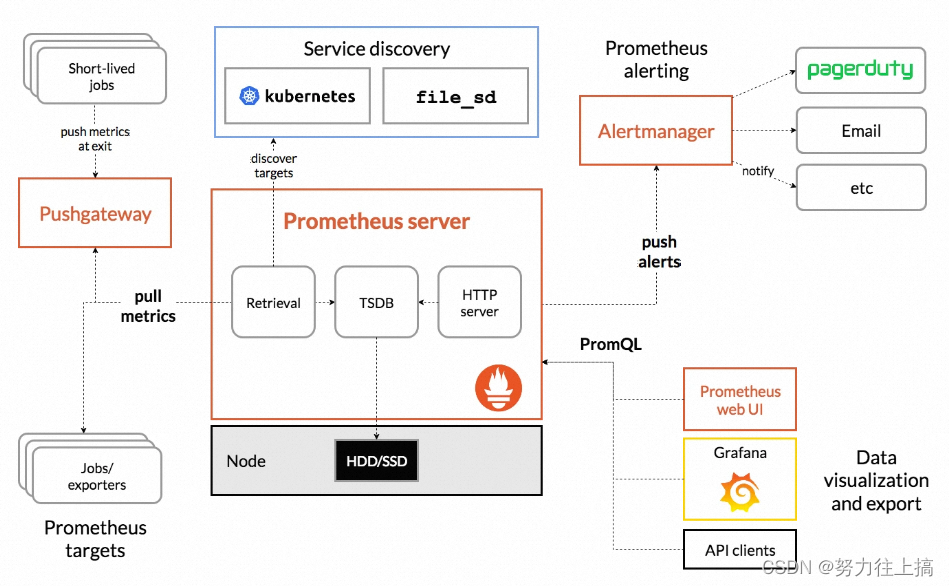
Prometheus 直接接收或者通过中间的 Pushgateway 网关被动获取指标数据,在本地存储所有的获取的指标数据,并对这些数据进行一些规则整理,用来生成一些聚合数据或者报警信息,Grafana 或者其他工具用来可视化这些数据。
1.1创建命名空间
kubectl create ns monitor
1.2 创建Prometheus配置文件# prometheus-cm.yaml
apiVersion: v1
kind: ConfigMap
metadata:
  name: prometheus-config
  namespace: monitor
data:
  prometheus.yml: |
    global:
      scrape_interval: 15s
      evaluation_interval: 15s

    alerting:
      alertmanagers:
        - static_configs:
            - targets: ["alertmanager:9093"]
            -
    rule_files:
      # - "first.rules"
      # - "second.rules"

    scrape_configs:
      - job_name: prometheus
        static_configs:
          - targets: ["localhost:9090"]

      - job_name: "kubernetes-apiservers"
        kubernetes_sd_configs:
          - role: endpoints
        scheme: https
        tls_config:
          ca_file: /var/run/secrets/kubernetes.io/serviceaccount/ca.crt
        bearer_token_file: /var/run/secrets/kubernetes.io/serviceaccount/token
        relabel_configs:
          - source_labels:
              [
                __meta_kubernetes_namespace,
                __meta_kubernetes_service_name,
                __meta_kubernetes_endpoint_port_name,
              ]
            action: keep
            regex: default;kubernetes;https

      - job_name: "kubernetes-nodes"
        kubernetes_sd_configs:
          - role: node
        relabel_configs:
          - source_labels: [__address__]
            regex: "(.*):10250"
            replacement: "${1}:9100"
            target_label: __address__
            action: replace
          - action: labelmap
            regex: __meta_kubernetes_node_label_(.+)

      - job_name: 'controller-manager'
        kubernetes_sd_configs:
        - role: endpoints
        scheme: https
        tls_config:
          insecure_skip_verify: true
        authorization:
          credentials_file: /var/run/secrets/kubernetes.io/serviceaccount/token
        relabel_configs:
        - source_labels: [__meta_kubernetes_namespace, __meta_kubernetes_service_name, __meta_kubernetes_endpoint_port_name]
          action: keep
          regex: kube-system;kube-controller-manager;https

      - job_name: 'kube-scheduler'
        kubernetes_sd_configs:
        - role: endpoints
        scheme: https
        tls_config:
          insecure_skip_verify: true
        authorization:
          credentials_file: /var/run/secrets/kubernetes.io/serviceaccount/token
        relabel_configs:
        - source_labels: [__meta_kubernetes_namespace, __meta_kubernetes_service_name, __meta_kubernetes_endpoint_port_name]
          action: keep
          regex: kube-system;kube-scheduler;https


      - job_name: 'etcd'
        kubernetes_sd_configs:
        - role: endpoints
        scheme: http
        relabel_configs:
        - source_labels: [__meta_kubernetes_namespace, __meta_kubernetes_service_name, __meta_kubernetes_endpoint_port_name]
          action: keep
          regex: kube-system;etcd;http

      - job_name: "etcd-https"
        metrics_path: "/metrics"
        kubernetes_sd_configs:
          - role: endpoints
        scheme: https
        tls_config:
          ca_file: /opt/categraf/pki/etcd/ca.crt
          cert_file: /opt/categraf/pki/etcd/client.crt
          key_file: /opt/categraf/pki/etcd/client.key
          insecure_skip_verify: true
        relabel_configs:
          - source_labels:
              [
                __meta_kubernetes_namespace,
                __meta_kubernetes_service_name,
                __meta_kubernetes_endpoint_port_name,
              ]
            action: keep
            regex: kube-system;etcd;https
#]kubectl apply -f prometheus-cm.yaml
configmap "prometheus-config" created
global 模块控制 Prometheus Server 的全局配置:
scrape_interval表示 prometheus 抓取指标数据的频率,默认是 15s,我们可以覆盖这个值
evaluation_interval:用来控制评估规则的频率,prometheus 使用规则产生新的时间序列数据或者产生警报
rule_files:指定了报警规则所在的位置,prometheus 可以根据这个配置加载规则,用于生成新的时间序列数据或者报警信息,当前我们没有配置任何报警规则。
scrape_configs 用于控制 prometheus 监控哪些资源。
1.3创建 prometheus 的 Pod 资源
# prometheus-deploy.yaml
apiVersion: apps/v1
kind: Deployment
metadata:
  name: prometheus
  namespace: monitor
  labels:
    app: prometheus
spec:
  selector:
    matchLabels:
      app: prometheus
  template:
    metadata:
      labels:
        app: prometheus
    spec:
      securityContext:
         runAsUser: 0  #使用指定root用户运行容器
      serviceAccountName: prometheus
      containers:
#        - image: prom/prometheus:v2.34.0
        - image: prom/prometheus:v2.44.0
          name: prometheus
          args:
            - "--config.file=/etc/prometheus/prometheus.yml"
            - "--storage.tsdb.path=/prometheus" # 指定tsdb数据路径
            - "--storage.tsdb.retention.time=24h"
            - "--web.enable-admin-api" # 控制对admin HTTP API的访问,其中包括删除时间序列等功能
            - "--web.enable-lifecycle" # 支持热更新,直接执行localhost:9090/-/reload立即生效
          ports:
            - containerPort: 9090
              name: http
          volumeMounts:
            - mountPath: "/etc/prometheus"
              name: config-volume
            - mountPath: "/prometheus"
              name: data
          resources:
            requests:
              cpu: 100m
              memory: 512Mi
            limits:
              cpu: 100m
              memory: 512Mi
      volumes:
        - name: data
          persistentVolumeClaim:
            claimName: prometheus-data
        - configMap:
            name: prometheus-config
          name: config-volume
–storage.tsdb.path=/prometheus 指定数据目录
创建如下所示的一个 PVC 资源对象,注意是一个 LocalPV,和 node1 节点具有亲和性:
mkdir /data/k8s/localpv/prometheus
---
apiVersion: v1
kind: PersistentVolume
metadata:
  name: pv-local
  labels:
    app: prometheus
spec:
  capacity:
    storage: 2Gi
  volumeMode: Filesystem
  accessModes:
  - ReadWriteOnce
  persistentVolumeReclaimPolicy: Retain
  storageClassName: local-storage-prometheus
  local:
    path: /data/k8s/localpv/prometheus  # 节点上的目录
  nodeAffinity:
    required:
      nodeSelectorTerms:
      - matchExpressions:
        - key: kubernetes.io/hostname
          operator: In
          values:
          - master
---
apiVersion: v1
kind: PersistentVolumeClaim
metadata:
  name: prometheus-data
  namespace: monitor
spec:
  selector:
    matchLabels:
      app: prometheus
  accessModes:
    - ReadWriteOnce
  resources:
    requests:
      storage: 1Gi
  storageClassName: local-storage-prometheus
---
# local-storageclass.yaml
apiVersion: storage.k8s.io/v1
kind: StorageClass
metadata:
  name: local-storage-prometheus     # StorageClass 的名字,叫作 local-storage-prometheus,也就是我们在 PV 中声明的
provisioner: kubernetes.io/no-provisioner   # 因为我们这里是手动创建的 PV,所以不需要动态来生成 PV
volumeBindingMode: WaitForFirstConsumer   # 延迟绑定
prometheus 需要访问 Kubernetes 的一些资源对象,所以需要配置 rbac 相关认证,这里我们使用了一个名为 prometheus 的 serviceAccount 对象:
# prometheus-rbac.yaml
apiVersion: v1
kind: ServiceAccount
metadata:
  name: prometheus
  namespace: monitor
---
apiVersion: rbac.authorization.k8s.io/v1
kind: ClusterRole
metadata:
  name: prometheus
rules:
  - apiGroups:
      - ""
    resources:
      - nodes
      - services
      - endpoints
      - pods
      - nodes/proxy
    verbs:
      - get
      - list
      - watch
  - apiGroups:
      - "extensions"
    resources:
      - ingresses
    verbs:
      - get
      - list
      - watch
  - apiGroups:
      - ""
    resources:
      - configmaps
      - nodes/metrics
    verbs:
      - get
  - nonResourceURLs:
      - /metrics
    verbs:
      - get
---
apiVersion: rbac.authorization.k8s.io/v1beta1
kind: ClusterRoleBinding
metadata:
  name: prometheus
roleRef:
  apiGroup: rbac.authorization.k8s.io
  kind: ClusterRole
  name: prometheus
subjects:
  - kind: ServiceAccount
    name: prometheus
    namespace: monitor
#]kubectl apply -f prometheus-rbac.yaml
serviceaccount "prometheus" created
clusterrole.rbac.authorization.k8s.io "prometheus" created
clusterrolebinding.rbac.authorization.k8s.io "prometheus" created
1.4创建Prometheus
kubectl apply -f prometheus-deploy.yaml
deployment.apps/prometheus created
➜ kubectl get pods -n monitor
NAME                         READY   STATUS             RESTARTS   AGE
prometheus-df4f47d95-vksmc   1/1     running  3          98s
1.5创建service
Pod 创建成功后,为了能够在外部访问到 prometheus 的 webui 服务,我们还需要创建一个 Service 对象:
# prometheus-svc.yaml
apiVersion: v1
kind: Service
metadata:
  name: prometheus
  namespace: monitor
  labels:
    app: prometheus
spec:
  selector:
    app: prometheus
  type: NodePort
  ports:
    - name: web
      port: 9090
      targetPort: http
#] kubectl apply -f prometheus-svc.yaml
service "prometheus" created
#] kubectl get svc -n monitor
NAME         TYPE       CLUSTER-IP     EXTERNAL-IP   PORT(S)          AGE
prometheus   NodePort   10.96.194.29   <none>        9090:30980/TCP   13h
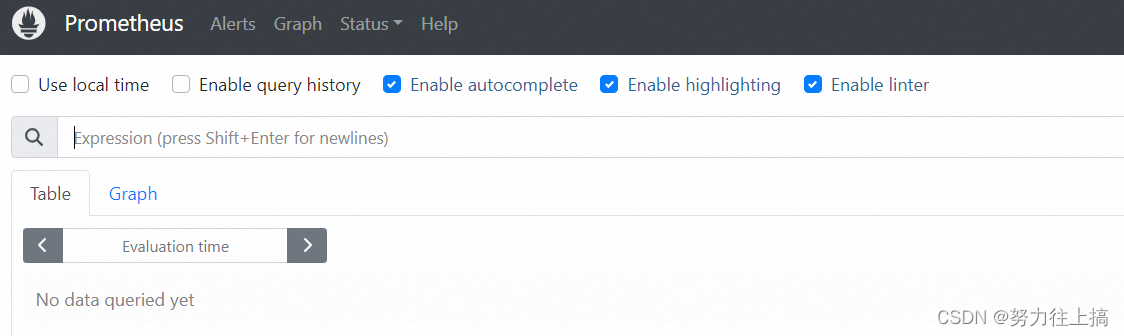
现在我们就可以通过 http://任意节点IP:30980 访问 prometheus 的 webui 服务了:
二、 AlertManager部署
2.1 安装AlertManager
alert manager配置文件
# alertmanager-config.yaml
apiVersion: v1
kind: ConfigMap
metadata:
name: alert-config
namespace: monitor
data:
config.yml: |-
global:
# 当alertmanager持续多长时间未接收到告警后标记告警状态为 resolved
resolve_timeout: 5m
# 配置邮件发送信息
smtp_smarthost: 'smtp.qq.com:25'
smtp_from: '257*******@qq.com'
smtp_auth_username: '257*******@qq.com'
smtp_auth_password: '<邮箱密码>'
smtp_hello: 'qq.com'
smtp_require_tls: false
# 所有报警信息进入后的根路由,用来设置报警的分发策略
route:
# 这里的标签列表是接收到报警信息后的重新分组标签,例如,接收到的报警信息里面有许多具有 cluster=A 和 alertname=LatncyHigh 这样的标签的报警信息将会批量被聚合到一个分组里面
group_by: ['alertname', 'cluster']
# 当一个新的报警分组被创建后,需要等待至少 group_wait 时间来初始化通知,这种方式可以确保您能有足够的时间为同一分组来获取多个警报,然后一起触发这个报警信息。
group_wait: 30s
# 相同的group之间发送告警通知的时间间隔
group_interval: 30s
# 如果一个报警信息已经发送成功了,等待 repeat_interval 时间来重新发送他们,不同类型告警发送频率需要具体配置
repeat_interval: 1h
# 默认的receiver:如果一个报警没有被一个route匹配,则发送给默认的接收器
receiver: default
# 上面所有的属性都由所有子路由继承,并且可以在每个子路由上进行覆盖。
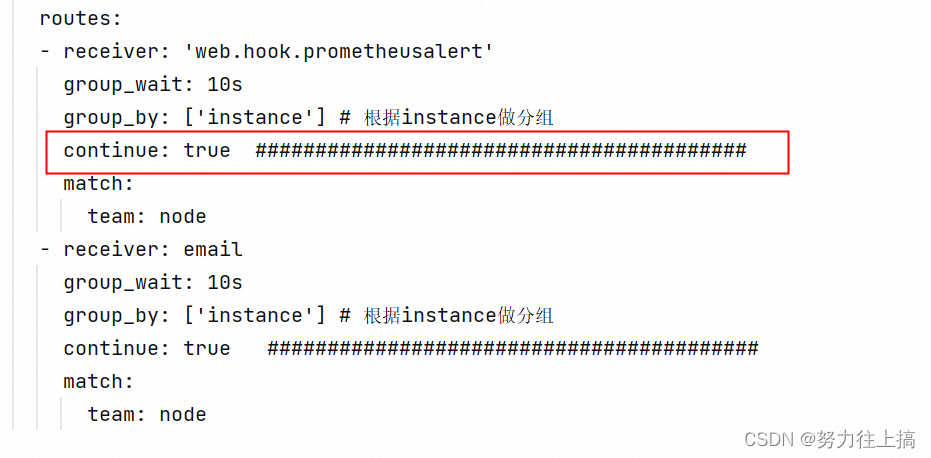
routes:
- receiver: email
group_wait: 10s
group_by: ['instance'] # 根据instance做分组
match:
team: node
receivers:
- name: 'default'
email_configs:
- to: '257*******@qq.com'
send_resolved: true # 接受告警恢复的通知
- name: 'email'
email_configs:
- to: '257*******@qq.com'
send_resolved: true
kubectl apply -f alertmanager-config.yaml
配置 AlertManager 的容器,直接使用一个 Deployment 来进行管理即可,对应的 YAML 资源声明如下:
apiVersion: apps/v1
kind: Deployment
metadata:
  name: alertmanager
  namespace: monitor
  labels:
    app: alertmanager
spec:
  selector:
    matchLabels:
      app: alertmanager
  template:
    metadata:
      labels:
        app: alertmanager
    spec:
      volumes:
        - name: alertcfg
          configMap:
            name: alert-config
      containers:
        - name: alertmanager
          image: prom/alertmanager:v0.24.0
          imagePullPolicy: IfNotPresent
          args:
            - "--config.file=/etc/alertmanager/config.yml"
          ports:
            - containerPort: 9093
              name: http
          volumeMounts:
            - mountPath: "/etc/alertmanager"
              name: alertcfg
          resources:
            requests:
              cpu: 100m
              memory: 256Mi
            limits:
              cpu: 100m
              memory: 256Mi
---
# alertmanager-svc.yaml
apiVersion: v1
kind: Service
metadata:
  name: alertmanager
  namespace: monitor
  labels:
    app: alertmanager
spec:
  selector:
    app: alertmanager
  type: NodePort
  ports:
    - name: web
      port: 9093
      targetPort: http
AlertManager 的容器启动起来后,我们还需要在 Prometheus 中配置下 AlertManager 的地址,让 Prometheus 能够访问到 AlertManager,在 Prometheus 的 ConfigMap 资源清单中添加如下配置:
alerting:
  alertmanagers:
    - static_configs:
        - targets: ["alertmanager:9093"]
执行 reload 操作即可。
在 Prometheus 的配置文件中添加如下报警规则配置:
rule_files:
  - /etc/prometheus/rules.yml
rule_files 就是用来指定报警规则的,这里我们同样将 rules.yml 文件用 ConfigMap 的形式挂载到 /etc/prometheus 目录下面即可,比如下面的规则:
apiVersion: v1
kind: ConfigMap
metadata:
  name: prometheus-config
  namespace: monitor
data:
  prometheus.yml: |
    global:
      scrape_interval: 15s
      scrape_timeout: 15s
      evaluation_interval: 30s  # 默认情况下每分钟对告警规则进行计算
    alerting:
      alertmanagers:
      - static_configs:
        - targets: ["alertmanager:9093"]
    rule_files:
    - /etc/prometheus/rules.yml
  ...... # 省略prometheus其他部分
  rules.yml: |
    groups:
    - name: test-node-mem
      rules:
      - alert: NodeMemoryUsage
        expr: (node_memory_MemTotal_bytes - (node_memory_MemFree_bytes + node_memory_Buffers_bytes + node_memory_Cached_bytes)) / node_memory_MemTotal_bytes * 100 > 20
        for: 2m
        labels:
          team: node
        annotations:
          summary: "{

    {

    $labels.instance}}: High Memory usage detected"
          description: "{

    {

    $labels.instance}}: Memory usage is above 20% (current value is: {

    { $value }}"
定义了一个名为 NodeMemoryUsage 的报警规则,一条报警规则主要由以下几部分组成:

alert:告警规则的名称
expr:是用于进行报警规则 PromQL 查询语句
for:评估等待时间(Pending Duration),用于表示只有当触发条件持续一段时间后才发送告警,在等待期间新产生的告警状态为 pending
labels:自定义标签,允许用户指定额外的标签列表,把它们附加在告警上
annotations:指定了另一组标签,它们不被当做告警实例的身份标识,它们经常用于存储一些额外的信息,用于报警信息的展示之类的
三、 Grafana部署
Grafana 是一个可视化面板,有着非常漂亮的图表和布局展示,功能齐全的度量仪表盘和图形编辑器,支持 Graphite、zabbix、InfluxDB、Prometheus、OpenTSDB、Elasticsearch 等作为数据源,比 Prometheus 自带的图表展示功能强大太多,更加灵活,有丰富的插件,功能更加强大。
3.1安装Grafana
这里我指定storageClassName: managed-nfs-storage
需要提前部署好storageclass,然后声明下就可以自动创建pv
本文采取local storageclass ,提前创建好路径
mkdir -p /data/k8s/localpv
---
#grafana.yaml
apiVersion: apps/v1
kind: Deployment
metadata:
  name: grafana
  namespace: monitor
spec:
  selector:
    matchLabels:
      app: grafana
  template:
    metadata:
      labels:
        app: grafana
    spec:
      volumes:
        - name: storage
          persistentVolumeClaim:
            claimName: grafana-pvc
      securityContext:
        runAsUser: 0
      containers:
        - name: grafana
#          image: grafana/grafana:8.4.6
          image: grafana/grafana:10.0.1
          imagePullPolicy: IfNotPresent
          ports:
            - containerPort: 3000
              name: grafana
          env:
            - name: GF_SECURITY_ADMIN_USER
              value: admin
            - name: GF_SECURITY_ADMIN_PASSWORD
              value: admin321
          readinessProbe:
            failureThreshold: 10
            httpGet:
              path: /api/health
              port: 3000
              scheme: HTTP
            periodSeconds: 10
            successThreshold: 1
            timeoutSeconds: 30
          livenessProbe:
            failureThreshold: 3
            httpGet:
              path: /api/health
              port: 3000
              scheme: HTTP
            periodSeconds: 10
            successThreshold: 1
            timeoutSeconds: 1
          resources:
            limits:
              cpu: 150m
              memory: 512Mi
            requests:
              cpu: 150m
              memory: 512Mi
          volumeMounts:
            - mountPath: /var/lib/grafana
              name: storage
---
#grafana-svc.yaml
apiVersion: v1
kind: Service
metadata:
  name: grafana
  namespace: monitor
spec:
  type: NodePort
  ports:
    - port: 3000
  selector:
    app: grafana

---
#grafana-pv.yaml
apiVersion: v1
kind: PersistentVolume
metadata:
  name: grafana-pv
  labels:
    app: grafana
spec:
  capacity:
    storage: 2Gi
  volumeMode: Filesystem
  accessModes:
  - ReadWriteOnce
  persistentVolumeReclaimPolicy: Retain
  storageClassName: local-storage
  local:
    path: /data/k8s/localpv  # 节点上的目录
  nodeAffinity:
    required:
      nodeSelectorTerms:
      - matchExpressions:
        - key: kubernetes.io/hostname
          operator: In
          values:
          - master
---
#grafana-pvc.yaml
apiVersion: v1
kind: PersistentVolumeClaim
metadata:
  name: grafana-pvc
  namespace: monitor
  labels:
    app: grafana
spec:
#  storageClassName: managed-nfs-storage
  storageClassName: local-storage
  accessModes:
    - ReadWriteOnce
  resources:
    requests:
      storage: 2Gi
---
# local-storageclass.yaml
apiVersion: storage.k8s.io/v1
kind: StorageClass
metadata:
  name: local-storage     # StorageClass 的名字,叫作 local-storage,也就是我们在 PV 中声明的
provisioner: kubernetes.io/no-provisioner   # 因为我们这里是手动创建的 PV,所以不需要动态来生成 PV
volumeBindingMode: WaitForFirstConsumer   # 延迟绑定
环境变量GF_SECURITY_ADMIN_USER 和 GF_SECURITY_ADMIN_PASSWORD,用来配置 grafana 的管理员用户和密码
grafana 将 dashboard、插件这些数据保存在 /var/lib/grafana 这个目录下面的,所以我们这里如果需要做数据持久化的话,就需要针对这个目录进行 volume 挂载声明
查看 grafana 对应的 Pod 是否正常:
[root@master grafana]# kubectl get pods -n monitor  -l app=grafana
NAME                       READY   STATUS    RESTARTS   AGE
grafana-85794dc4d9-mhcj7   1/1     Running   0          7m12s
[root@master grafana]# kubectl logs -f grafana-85794dc4d9-mhcj7 -n monitor
...
logger=settings var="GF_SECURITY_ADMIN_USER=admin"
t=2019-12-13T06:35:08+0000 lvl=info msg="Config overridden from Environment variable"
......
t=2019-12-13T06:35:08+0000 lvl=info msg="Initializing Stream Manager"
t=2019-12-13T06:35:08+0000 lvl=info msg="HTTP Server Listen" logger=http.server address=[::]:3000 protocol=http subUrl= socket=

[root@master grafana]# kubectl get svc -n monitor
NAME      TYPE       CLUSTER-IP    EXTERNAL-IP   PORT(S)          AGE
grafana   NodePort   10.98.74.79   <none>        3000:31197/TCP   8m26s
在浏览器中使用 http://<任意节点IP:31197> 来访问 grafana 这个服务配置数据源:

Prometheus 和 Grafana 都处于 kube-mon 这同一个 namespace 下面,所以我们这里的数据源地址:http://prometheus:9090(因为在同一个 namespace 下面所以直接用 Service 名也可以)
四、 1.prometheusAlert部署
github 地址:https://github.com/feiyu563/PrometheusAlert
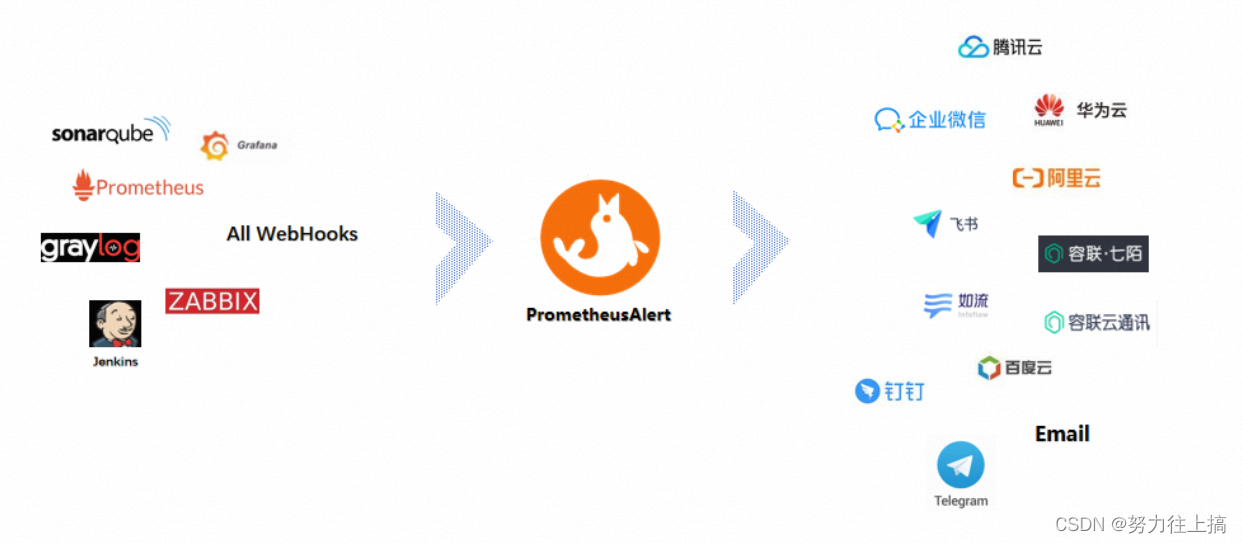
PrometheusAlert是开源的运维告警中心消息转发系统,支持主流的监控系统Prometheus、Zabbix,日志系统Graylog2,Graylog3、数据可视化系统Grafana、SonarQube。阿里云-云监控,以及所有支持WebHook接口的系统发出的预警消息,支持将收到的这些消息发送到钉钉,微信,email,飞书,腾讯短信,腾讯电话,阿里云短信,阿里云电话,华为短信,百度云短信,容联云电话,七陌短信,七陌语音,TeleGram,百度Hi(如流)等。
PrometheusAlert可以部署在本地和云平台上,支持windows、linux、公有云、私有云、混合云、容器和kubernetes。你可以根据实际场景或需求,选择相应的方式来部署PrometheusAlert:
https://github.com/feiyu563/PrometheusAlert/blob/master/doc/readme/base-install.md
本文采用在kubernetes中运行:
提前下载镜像:
docker pull feiyu563/prometheus-alert
[root@master ~]# docker images  | grep prometheus-alert
feiyu563/prometheus-alert                                                 latest                   d68864d68c3e   19 months ago   38.9MB
#Kubernetes中运行可以直接执行以下命令行即可(注意默认的部署模版中未挂载模版数据库文件 db/PrometheusAlertDB.db,为防止模版数据丢失,请自行增加挂载配置 )
kubectl apply -n monitoring -f https://raw.githubusercontent.com/feiyu563/PrometheusAlert/master/example/kubernetes/PrometheusAlert-Deployment.yaml

#启动后可使用浏览器打开以下地址查看:http://[YOUR-PrometheusAlert-URL]:8080
#默认登录帐号和密码在app.conf中有配置
[root@master prometheusalert]# kubectl  logs prometheus-alert-center-7f76d88c98-fnjzz
pass!
table `prometheus_alert_d_b` already exists, skip
table `alert_record` already exists, skip
2023/08/14 10:07:46.483 [I] [proc.go:225]  [main] 构建的Go版本: go1.16.5
2023/08/14 10:07:46.483 [I] [proc.go:225]  [main] 应用当前版本: v4.6.1
2023/08/14 10:07:46.483 [I] [proc.go:225]  [main] 应用当前提交: 1bc0791a637b633257ce69de05d57b79ddd76f7c
2023/08/14 10:07:46.483 [I] [proc.go:225]  [main] 应用构建时间: 2021-12-23T12:37:35+0000
2023/08/14 10:07:46.483 [I] [proc.go:225]  [main] 应用构建用户: root@c14786b5a1cd
2023/08/14 10:07:46.491 [I] [asm_amd64.s:1371]  http server Running on http://0.0.0.0:8080
把svc的type修改为nodeport
[root@master prometheusalert]# kubectl  edit svc prometheus-alert-center
service/prometheus-alert-center edited

[root@master prometheusalert]# kubectl  get svc -A
NAMESPACE     NAME                              TYPE        CLUSTER-IP       EXTERNAL-IP   PORT(S)                  AGE
default       service/kubernetes                ClusterIP   10.96.0.1        <none>        443/TCP                  11d
default       service/prometheus-alert-center   NodePort    10.105.133.163   <none>        8080:32021/TCP           2m19s
kube-system   service/kube-dns                  ClusterIP   10.96.0.10       <none>        53/UDP,53/TCP,9153/TCP   11d
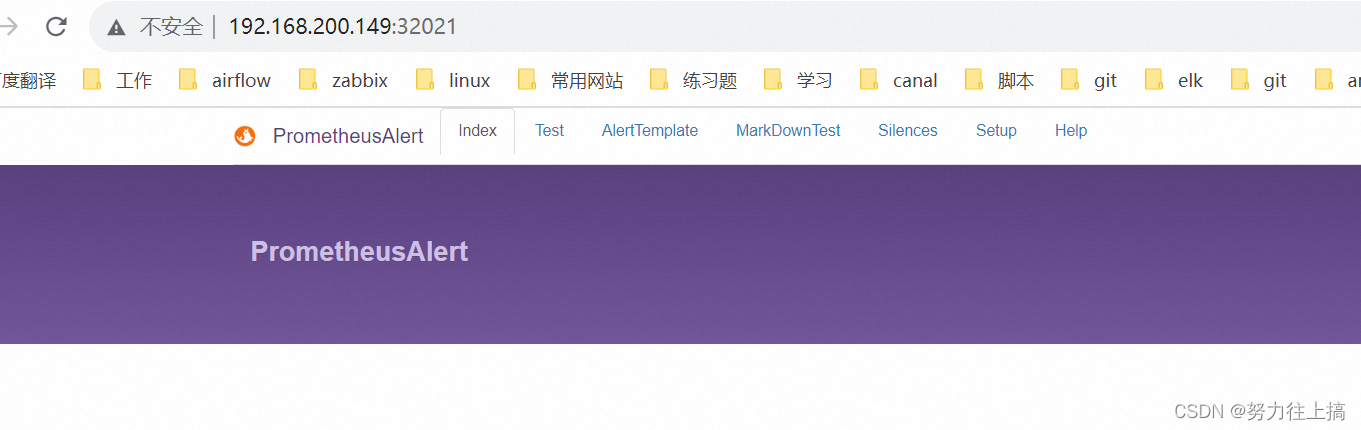
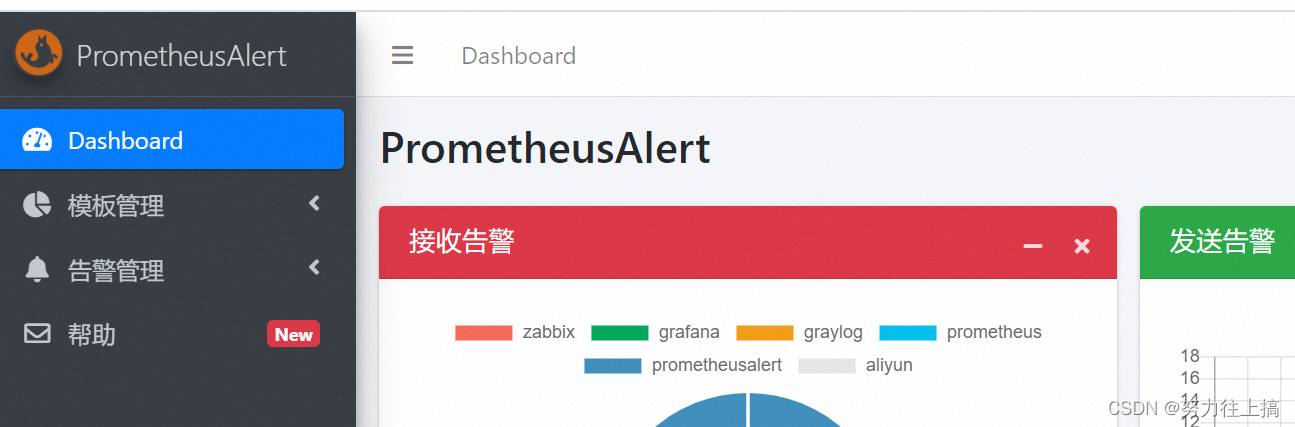
浏览器访问任意节点http://<任意节点ip>:32021
因github地址所提供的容器化镜像老旧,可以自行编写dockerfile下载二进制包封装成镜像部署到k8s
2.prometheusAlert部署(二进制)
#打开PrometheusAlert releases页面,根据需要选择需要的版本下载到本地解压并进入解压后的目录
如linux版本(https://github.com/feiyu563/PrometheusAlert/releases/download/v4.9/linux.zip)

# wget https://github.com/feiyu563/PrometheusAlert/releases/download/v4.9/linux.zip && unzip linux.zip && cd linux/

#下载好后解压并进入解压后的文件夹


#运行PrometheusAlert
./PrometheusAlert (#后台运行请执行 nohup ./PrometheusAlert &)

#启动后可使用浏览器打开以下地址查看:http://127.0.0.1:8080
#默认登录帐号和密码在app.conf中有配置
注:
1.配置告警路由
https://github.com/feiyu563/PrometheusAlert/blob/master/doc/readme/web-router.md
2.开启告警记录
#是否开启告警记录 0为关闭,1为开启
AlertRecord=1
五、钉钉配置
开启钉钉机器人
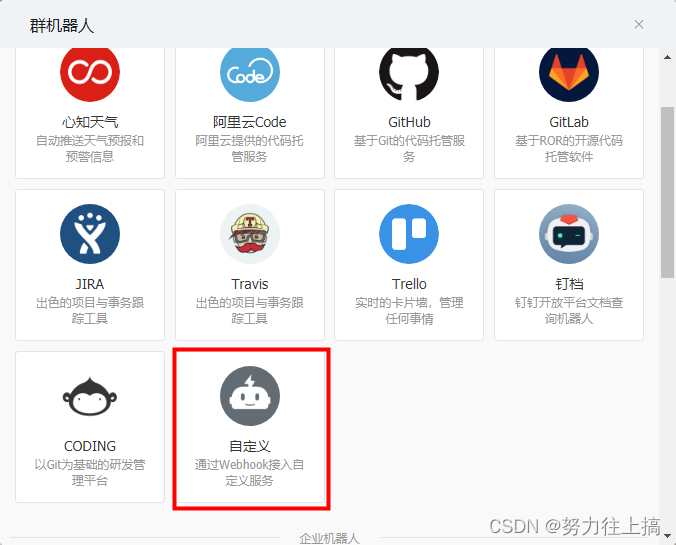
打开钉钉,进入钉钉群中,选择群设置–>智能群助手–>添加机器人–>自定义,可参下图:

新版本的钉钉加了安全设置,只需选择安全设置中的 自定义关键词 即可,并将关键词设置为 Prometheus或者app.conf中设置的title值均可,参考下图
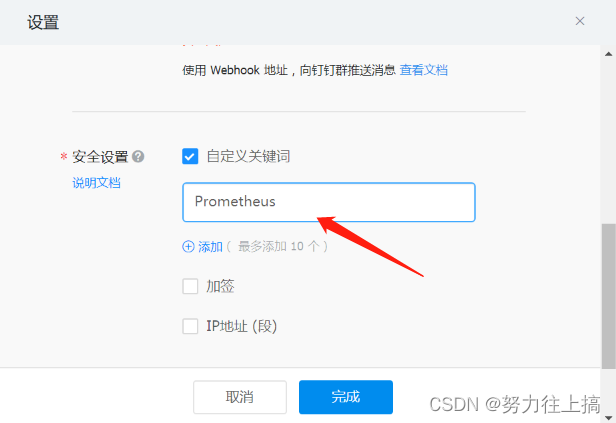
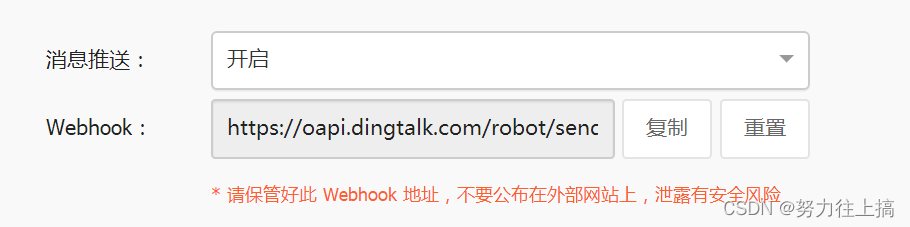
复制图中的Webhook地址,并填入PrometheusAlert配置文件app.conf中对应配置项即可。
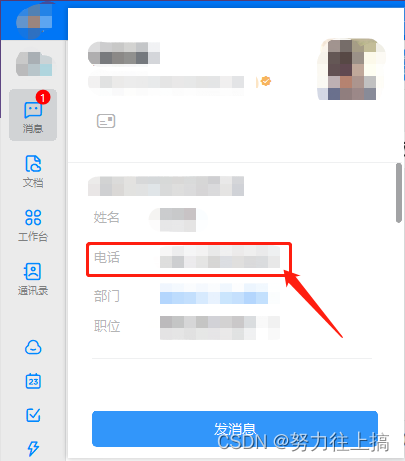
PS: 钉钉机器人目前已经支持 @某人 ,使用该功能需要取得对应用户的钉钉关联手机号码,如下图:
钉钉目前支持只支持markdown语法的子集,具体支持的元素如下:
标题
# 一级标题
## 二级标题
### 三级标题
#### 四级标题
##### 五级标题
###### 六级标题
引用
> A man who stands for nothing will fall for anything.
文字加粗、斜体
**bold**
*italic*
链接
[this is a link](http://name.com)
图片

无序列表
- item1
- item2
有序列表
1. item1
2. item2
钉钉相关配置:
#---------------------↓全局配置-----------------------
#告警消息标题
title=PrometheusAlert
#钉钉告警 告警logo图标地址
logourl=https://raw.githubusercontent.com/feiyu563/PrometheusAlert/master/doc/alert-center.png
#钉钉告警 恢复logo图标地址
rlogourl=https://raw.githubusercontent.com/feiyu563/PrometheusAlert/master/doc/alert-center.png
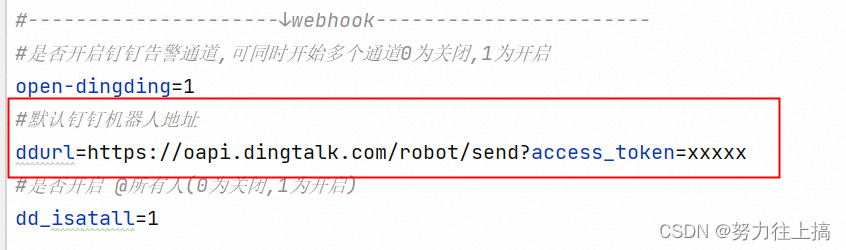
#---------------------↓webhook-----------------------
#是否开启钉钉告警通道,可同时开始多个通道0为关闭,1为开启
open-dingding=1
#默认钉钉机器人地址
ddurl=https://oapi.dingtalk.com/robot/send?access_token=xxxxx
#是否开启 @所有人(0为关闭,1为开启)
dd_isatall=1
以Prometheus配合自定义模板为例:
Prometheus配置参考:
global:
  resolve_timeout: 5m
route:
  group_by: ['instance']
  group_wait: 10m
  group_interval: 10s
  repeat_interval: 10m
  receiver: 'web.hook.prometheusalert'
receivers:
- name: 'web.hook.prometheusalert'
  webhook_configs:
  - url: 'http://[prometheusalert_url]:8080/prometheusalert?type=dd&tpl=prometheus-dd&ddurl=钉钉机器人地址,钉钉机器人地址2&at=18888888888,18888888889'
若想指定报警发送多个方式比如邮箱+钉钉,可以在routes下加continue: true 实现