1.1项目完成的功能与特色
(1)功能:对2016—2018课程的平时、期中、期末三个不同的分数进行数据清洗和分析,最后以合适的柱状图、折线图、饼图等方式表示出来并在网页上渲染
(2)特色:图表能够清晰得呈现不同分数得高低,一目了然得看出最高分、最低分、平均分,观察图表的人能够迅速得获取自己所想要的信息,通过图的呈现能够很快发现自己班级的分数差距,清楚得掌握班级分数得差距。
二、各模块详细描述(名称,功能,运行截图,关键源代码)
(1):对数据的清洗
self.data=xlrd.open_workbook(filedata)
table=self.data.sheet_by_index(0)#获取2016年的表
nrows=table.nrows#获取总行数
ncols=table.ncols#获得总列数
zero=table.col_values(0)#获得第一列的值
one=table.col_values(1)
two=table.col_values(2)
three=table.col_values(3)
five=table.col_values(4)#获得第四列的值
zero.pop(0)#去掉第一行
one.pop(0)#去掉第二行
two.pop(0)#去掉第三行
three.pop(0)#去掉第四行
five.pop(0)#去掉第五行
for i in zero:
if i not in self.class_list:
self.class_list.append(i)
list1=[]
for e in range(0,len(zero)):
#print(zero1[e],five1[e])
if five[e]!='缺考\xa0':
list1.append(zero[e])
list1.append(one[e])
list1.append(two[e])
list1.append(three[e])
list1.append(five[e])
self.data2016_list1.append(list1) # 存2016年表格得全部数据[[班级,性别,平时,期中,总评]],列表套列表
list1=[]
table=self.data.sheet_by_index(1)#获得2017年
nrows=table.nrows#获取总行数
ncols=table.ncols#获得总列数
zero1=table.col_values(0)#获得第一列的值
one1=table.col_values(1)
two1=table.col_values(2)
three1=table.col_values(3)
five1=table.col_values(4)#获得第四列的值
zero1.pop(0)#去掉第一行
one1.pop(0)#去掉第二行
two1.pop(0)#去掉第三行
three1.pop(0)#去掉第四行
five1.pop(0)#去掉第五行
for i in zero1:
if i not in self.class_list1:
self.class_list1.append(i)
for e in range(0,len(zero1)):
if five1[e]!='缺考\xa0':
list1.append(zero1[e])
list1.append(one1[e])
list1.append(two1[e])
list1.append(three1[e])
list1.append(five1[e])
self.data2017_list1.append(list1)
list1=[]
table=self.data.sheet_by_index(2)#获取2018年的表
nrows=table.nrows#获取总行数
ncols=table.ncols#获得总列数
zero2=table.col_values(0)#获得第一列的值
one2=table.col_values(1)
two2=table.col_values(2)
three2=table.col_values(3)
five2=table.col_values(4)#获得第四列的值
zero2.pop(0)#去掉第一行
one2.pop(0)#去掉第二行
two2.pop(0)#去掉第三行
three2.pop(0)#去掉第四行
five2.pop(0)#去掉第五行
for i in zero2:
if i not in self.class_list2:
self.class_list2.append(i)
for e in range(len(zero2)):
if five2[e]!='缺考\xa0':
list1.append(zero2[e])
list1.append(one2[e])
list1.append(two2[e])
list1.append(three2[e])
list1.append(five2[e])
self.data2018_list1.append(list1)
list1=[]
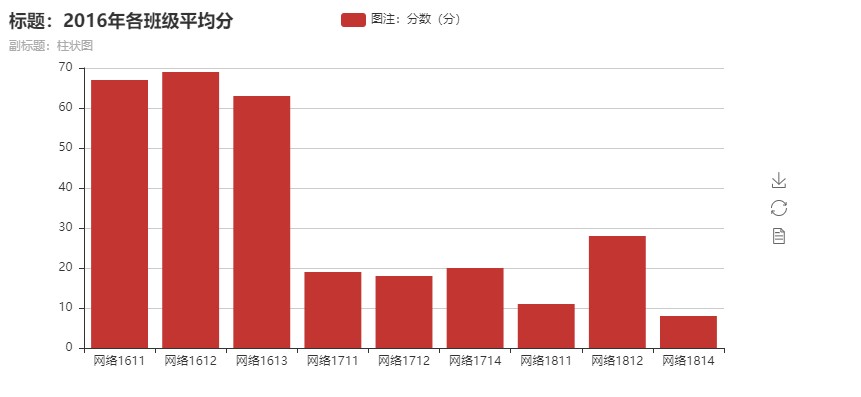
(2):2016年各班级平均分,柱状图
list1=[]
score_list=[]
for i in range(len(self.class_list)):
sum1=0
count=0
score=[]
for j in range(len(self.data2016_list1)):
if self.class_list[i] in self.data2016_list1[j]:
sum1=sum1+int(self.data2016_list1[j][4])
count=count+1
if count>0:
avg=int(sum1/count)
score.append(self.class_list[i])
score.append(avg)
score_list.append(score)
avg_list=[]
for i in range(len(score_list)):
avg_list.append(score_list[i][1])
bar=Bar("标题:2016年各班级平均分","副标题:柱状图")
bar.add("图注:分数(分)",self.class_list,avg_list)
bar.render('2016年各班级平均分.html')
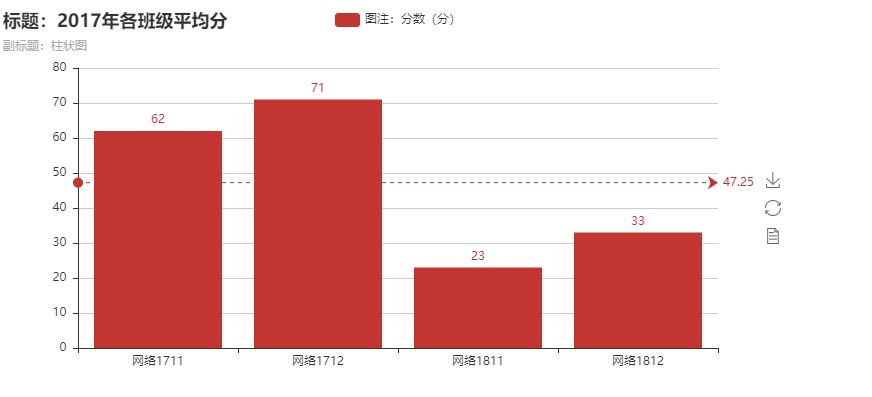
(3):2017年各班级平均分柱状图
list1=[]
score_list2=[]
for i in range(len(self.class_list2)):
sum1=0
count=0
score2=[]
for j in range(len(self.data2018_list1)):
if self.class_list2[i] in self.data2018_list1[j]:
sum1=sum1+int(self.data2018_list1[j][4])
count=count+1
if count>0:
avg=float(sum1/count)
score2.append(self.class_list2[i])
score2.append(avg)
score_list2.append(score2)
avg_list2=[]#存放算出来的平均数
for i in range(len(score_list2)):
avg_list2.append(score_list2[i][1])
bar=Bar("标题:2018年各班级平均分","副标题:柱状图")
bar.add("图注:分数(分)",self.class_list2,avg_list2)
bar.render('2018年各班级平均分柱状图.html')
(4):不同总体平均分情况柱状图
self.sheet_list =self.data.sheet_names()#获得表名字,2016级,2017,2018三个
#print(sheet_list)
list2=[]
sum1=0
count=0
for e in self.data2016_list1:
if e:
sum1+=int(e[4])
count+=1
list2.append(int(sum1/count))
sum1=0
count=0
for e in self.data2017_list1:
if e:
sum1+=int(e[4])
count+=1
list2.append(int(sum1/count))
sum1=0
count=0
for e in self.data2018_list1:
if e:
sum1+=int(e[4])
count+=1
list2.append(int(sum1/count))
bar=Bar("标题:不同年份总体平均分情况","副标题:柱状图")
bar.add("图注:分数(分)",self.sheet_list,list2)
bar.render('不同总体平均分情况.html')

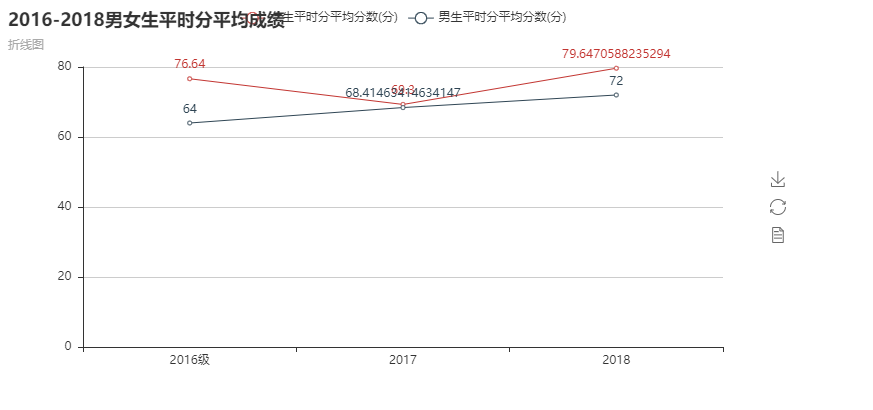
(5):2016-2018男女生平时分平均成绩折线图
line=Line('2016-2018男女生平时分平均成绩','折线图')
line.add("女生平时分平均分数(分)",self.sheet_list,avglist1,is_label_show=True)
line.add("男生平时分平均分数(分)",self.sheet_list,avglist4,is_label_show=True)
line.render('2016-2018男女生平时分平均成绩折线图.html')
(6):2016年平时、期中、期末饼状图
pie = Pie("饼状图", "2016年平时、期中、期末饼状图",title_pos='center',width=900)
#上方的colums选项取消显示,显示label标签
pie.add("2016年各个项目,courselist,avglist11 ,is_legend_show=False,is_label_show=True)
#保存图表
pie.render('2016年各项平均分饼状图.html')

(7):2016年男女生总评堆积柱状图
bar = Bar("2016年男女生总评堆积柱状图")
bar.add("男生", self.sheet_list, avglist3, is_stack=True)
bar.add('女生', self.sheet_list, avglist6, is_stack=True)
bar.render('2016年男女生总评堆积柱状图.html')

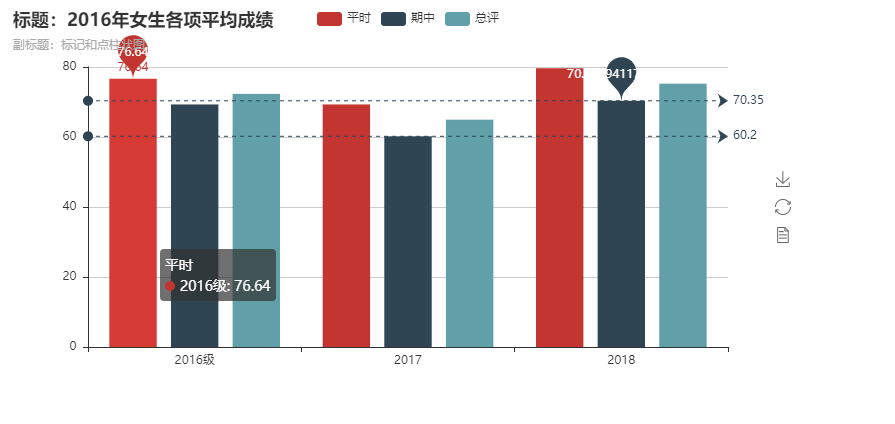
(8):2016—2018年女生平时、期中、总评成绩柱状图、显示最大值和最小值、平均分数线
data1 = [12,13,14,25,67]
data2 = [34,56,78,45,67]
labels = ['A', 'B', 'C', 'D', 'E']
bar=Bar("标题:2016年女生各项平均成绩","副标题:标记和点柱状图")
bar.add('平时', self.sheet_list, avglist1, mark_point=['average'])
bar.add('期中', self.sheet_list, avglist2, mark_point=['max'], mark_line=['min', 'max'])
bar.add('总评', self.sheet_list, avglist3)
bar.render('2016年女生成绩标记和点柱状图.html')
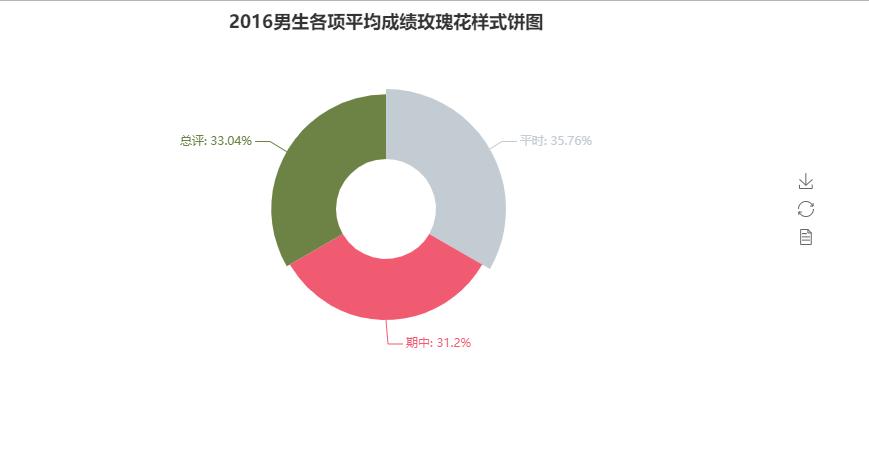
(9):2016男生各项平均成绩玫瑰花样式饼图
pie2 = Pie("2016男生各项平均成绩玫瑰花样式饼图", title_pos='center', width=900)
pie2.add("2016男生", courselist, avglist41,is_random=True, radius=[25, 60], rosetype='area', is_legend_show=False, is_label_show=True)
pie2.show_config()
pie2.render('2016男生各项平均成绩玫瑰花样式饼图.html')
(10):2016-2018年男生各项平均成绩时间轴饼图
pie_1 = Pie("2016年男生各项平均成绩")
pie_1.add("男生", courselist, avglist41,is_label_show=True, radius=[30, 55], rosetype='radius')
pie_2 = Pie("2017年男生各项平均成绩")
pie_2.add("男生", courselist,avglist51,is_label_show=True, radius=[30, 55], rosetype='radius')
pie_3 = Pie("2018年男生各项平均成绩")
pie_3.add("男生", courselist,avglist61,is_label_show=True, radius=[30, 55], rosetype='radius')
timeline = Timeline(is_auto_play=True, timeline_bottom=0)
timeline.add(pie_1, '2016 年')
timeline.add(pie_2, '2017 年')
timeline.add(pie_3, '2018 年')
timeline.render('2016-2018年男生各项平均成绩时间轴饼图.html')

(11):网页渲染:
from flask import Flask, jsonify, render_template, request, url_for

from werkzeug.utils import redirect


app = Flask(__name__)


@app.route("/index")

def index():

    return render_template("index.html")


@app.route("/gra", methods=['GET', 'POST'])

def getValues():

    text = request.form.get('课程成绩')

    if text == '课程成绩1':

        return render_template("2016年各班级平均分.html")

    elif text=='课程成绩2':

        return render_template("2017年各班级平均分柱状图.html")

    elif text=="课程成绩3":

        return render_template("2018年各班级平均分柱状图.html")

    elif text=="课程成绩4":

        return render_template("不同总体平均分情况.html")

    elif text=="课程成绩5":

        return render_template("2016-2018男女生平时分平均成绩折线图.html")

    elif text=="课程成绩6":

        return render_template("2016男生各项平均成绩玫瑰花样式饼图.html")

    elif text=="课程成绩7":

        return render_template("2016年各项平均分饼状图.html")

    elif text=="课程成绩8":

        return render_template("2016年女生成绩标记和点柱状图.html")

    elif text=="课程成绩9":

        return render_template("2016年男女生总评堆积柱状图.html")

    elif text=="课程成绩10":

        return render_template("2016-2018年男生各项平均成绩时间轴饼图.html")

    else:

        return "不存在"


if __name__ == '__main__':

    app.run(host='127.9.9.7', port=8888, debug=True)
三、运用到的知识
(1)运用flask框架、python语言、html5语言。
(2)Numpy:增强了Python的科学计算和数据处理能力。
(3)Matplotlab:专业画图工具
(4)Pandas:为数据的读取、数据清洗、数据快速分析提供强大的便捷。
(5)pyecharts:可将图表生成html文件,直接用于交互式的页面可视化,也可以生成Jupyter Notebook格式。将数据清晰得展示出来。