气象netCDF数据可视化分析
版权声明:本文为博主原创文章,遵循 CC 4.0 BY-SA 版权协议,转载请附上原文出处链接和本声明。
前言
- NetCDF(network Common Data Form)网络通用数据格式是由美国大学大气研究协会(University Corporation for Atmospheric Research,UCAR)的Unidata项目科学家针对科学数据的特点开发的,是一种面向数组型并适于网络共享的数据的描述和编码标准。
对程序员来说,它和zip、jpeg、bmp文件格式类似,都是一种文件格式的标准。netcdf文件开始的目的是用于存储气象科学中的数据,现在已经成为许多数据采集软件的生成文件的格式。
特点:NetCDF文件是自描述的二进制数据格式,即自带描述属性信息。通常包含了变量、维度和属性,变量包含了维度、属性(如数据单位)信息及变量的值。维度部分记录的是每个变量的维度名及长度。属性部分包含了一些额外信息,比如文件创建者等。
- 很多工具都可以处理NetCDF文件,比如MATLAB,Python,Java,NCL,GrADS,CDO,NCO,Panoply,ArcMap等等。NetCDF文件数据下载地址
- 这里主要讲一下如何利用D3在前端处理NetCDF文件进行可视化分析。
- 核心代码如下
<script>
//--------------------------------------
// 缩放控制
function zoomed() {
  var transform = d3.event.transform;
  projection.scale(scale * transform.k);
  updatePaths(svg);
}
//--------------------------------------
function dragstarted() {
  v0 = versor.cartesian(projection.invert(d3.mouse(this)));
  r0 = projection.rotate();
  q0 = versor(r0);
}
//--------------------------------------
// 拖拽控制
function dragged(d) {
  var v1 = versor.cartesian(projection.rotate(r0).invert(d3.mouse(this))),
      q1 = versor.multiply(q0, versor.delta(v0, v1)),
      r1 = versor.rotation(q1);
  projection.rotate(r1);
  updatePaths(svg);
}
//--------------------------------------
function updatePaths(svg) {
  svg.forEach(function(e) {
     	e.selectAll('path.contours').attr("d", geoPath);
     	e.selectAll('path.graticule').attr('d', geoPath);
     	e.selectAll('path.land').attr('d', geoPath);
  });
}
//--------------------------------------
function createMap(id, values, range) {
  var svg = d3.select('body').select(id).append('svg')
    .attr('width', width)
    .attr('height', height);
  var group = svg.append("g").datum([]);
  var extent = d3.extent(values);
  // 颜色插值
  var color = d3.scaleSequential(d3.interpolatePlasma)
      //.domain(d3.extent(values));
      .domain(range);
  // console.log(d3.extent(values));
  // 生成等值线
  var contours = d3.contours()
      .thresholds(d3.range(Math.floor(extent[0]/delta)*delta, Math.ceil(extent[1]/delta)*delta, delta))
      .smooth(true)
      .size([isize, jsize]);
  // 对生成的等值线进行填色
  group
   //.attr("class", "contour-stroke")
   .selectAll("path")
   .data(contours(values).map(invert))
   .enter().append("path")
   .attr('class', 'contours')
   .attr("fill", function(d) { return color(d.value); })
   .attr("d", geoPath);
  group.append('path')
    .datum(graticule)
    .attr('class', 'graticule')
    .attr('d', geoPath);
  group.append("path")
      .datum(world)
      .attr("class", "land")
      .attr("d", geoPath);
  // zoom on svg; drag on group
  group.call(d3.drag().on('start', dragstarted)
		      .on('drag', dragged));
  svg.call(d3.zoom().on('zoom', zoomed));
  return svg;
}
//==========================================
function invert(d) {
    var shared = {};
    var p = {
        type: "Polygon",
        coordinates: d3.merge(d.coordinates.map(function(polygon) {
            return polygon.map(function(ring) {
                return ring.map(function(point) {
                    return [point[0] / isize * 360 - 180, 90 - point[1] / jsize * 180];
                }).reverse();
            });
        }))
    };
    // Record the y-intersections with the antimeridian.
    p.coordinates.forEach(function(ring) {
        ring.forEach(function(p) {
            if (p[0] === -180 || p[0] === 180) {
                shared[p[1]] |= p[0] === -180 ? 1 : 2;
            }
        });
    });

    // Offset any unshared antimeridian points to prevent their stitching.
    p.coordinates.forEach(function(ring) {
        ring.forEach(function(p) {
            if ((p[0] === -180 || p[0] === 180) && shared[p[1]] !== 3) {
                p[0] = p[0] === -180 ? -179.9995 : 179.9995;
            }
        });
    });

    p = d3.geoStitch(p);

    // If the MultiPolygon is empty, treat it as the Sphere.
    return p.coordinates.length
        ? {type: "Polygon", coordinates: p.coordinates, value: d.value}
        : {type: "Sphere", value: d.value};
}
//==========================================
function reverseVar(values) {
    values = nj.array(values).reshape(jsize,isize);
    values = values.slice([null, null, -1],null);
    values = values.flatten().tolist();

    return values;
}

//==========================================
var svg = [];
var world;
var graticule;

var width = 400,
    height = 400,
    scale = 200,
    origin = {x: 55, y: -40};

var v0, // Mouse position in Cartesian coordinates at start of drag gesture.
    r0, // Projection rotation as Euler angles at start.
    q0; // Projection rotation as versor at start.
// 正交投影
var projection = d3.geoOrthographic()
    .scale(scale)
    .translate([width/2, height/2])
    .rotate([origin.x, origin.y])
    .center([0, 0]);
// 确定投影坐标系
var geoPath = d3.geoPath()
    .projection(projection);

var min = -12;
var max = 12;
var delta = 2;
var nbLevels = Math.abs(max-min)/delta + 1;

var color = d3.scaleSequential(d3.interpolatePlasma)
    .domain([min,max]);

//==========================================
var urlpath =  "navy_winds_2.nc"
var reader;
var isize, jsize;
// 读取netCDF文件数据
var oReq = new XMLHttpRequest();
oReq.open("GET", urlpath, true);
oReq.responseType = "blob";

oReq.onload = function(oEvent) {
  var blob = oReq.response;
  reader_url = new FileReader();

  reader_url.onload = function(e) {
  //====================================================================================
    reader = new netcdfjs(this.result);

    isize = reader.dimensions[0].size;
    jsize = reader.dimensions[1].size;

    var dim0Name = reader.dimensions[0].name;
    var dim1Name = reader.dimensions[1].name;
    axis0 = reader.getDataVariable(dim0Name);
    axis1 = reader.getDataVariable(dim1Name);

    var valuesVar1 = reader.getDataVariable('UWND');
    valuesVar1 = reverseVar(valuesVar1);
    var valuesVar2 = reader.getDataVariable('VWND');
    valuesVar2 = reverseVar(valuesVar2);

    range = [-12, 12];

    d3.json("world-110m.json", function(error, worldJSON) {
      if (error) throw error;
      world = topojson.feature(worldJSON, worldJSON.objects.land);
      graticule = d3.geoGraticule();

      svg1 = createMap("#map1", valuesVar1, range);
      svg.push(svg1);

      svg2 = createMap("#map2", valuesVar2, range);
      svg.push(svg2);

		svgLegend = d3.select("#legend").append('svg')
			.attr('width', 60)
			.attr('height', 800);
		svgLegend.append("g").attr("class", "legendLinear");
		var legendLinear = d3.legendColor()
			.shapeWidth(15)
			.shapeHeight(15)
			.shapePadding(1)
			.cells(nbLevels)
			.orient('vertical')
			.ascending(true)
			.labelAlign('start')
			.scale(color);
		svgLegend.select(".legendLinear")
			.call(legendLinear);

   });

  //====================================================================================
  }

  reader_url.readAsArrayBuffer(blob);

}
oReq.send(); //start process

</script>
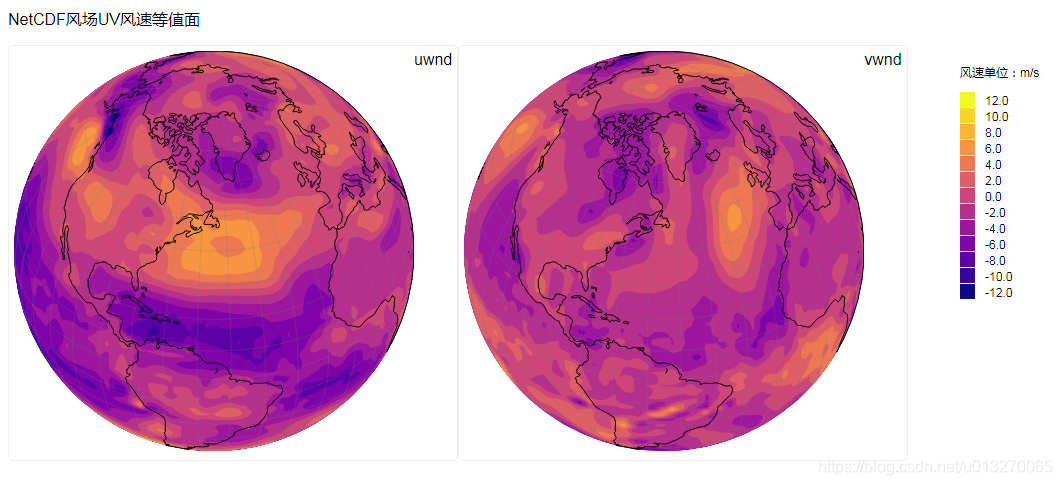
风场数据可视化结果图