版权声明:本文为博主原创文章,遵循 CC 4.0 BY-SA 版权协议,转载请附上原文出处链接和本声明。
介绍
Echarts图形控件,可方便的对数据进行可视化的展示,支持折线、柱状、圆形等多种图表
源码工程地址:Echarts
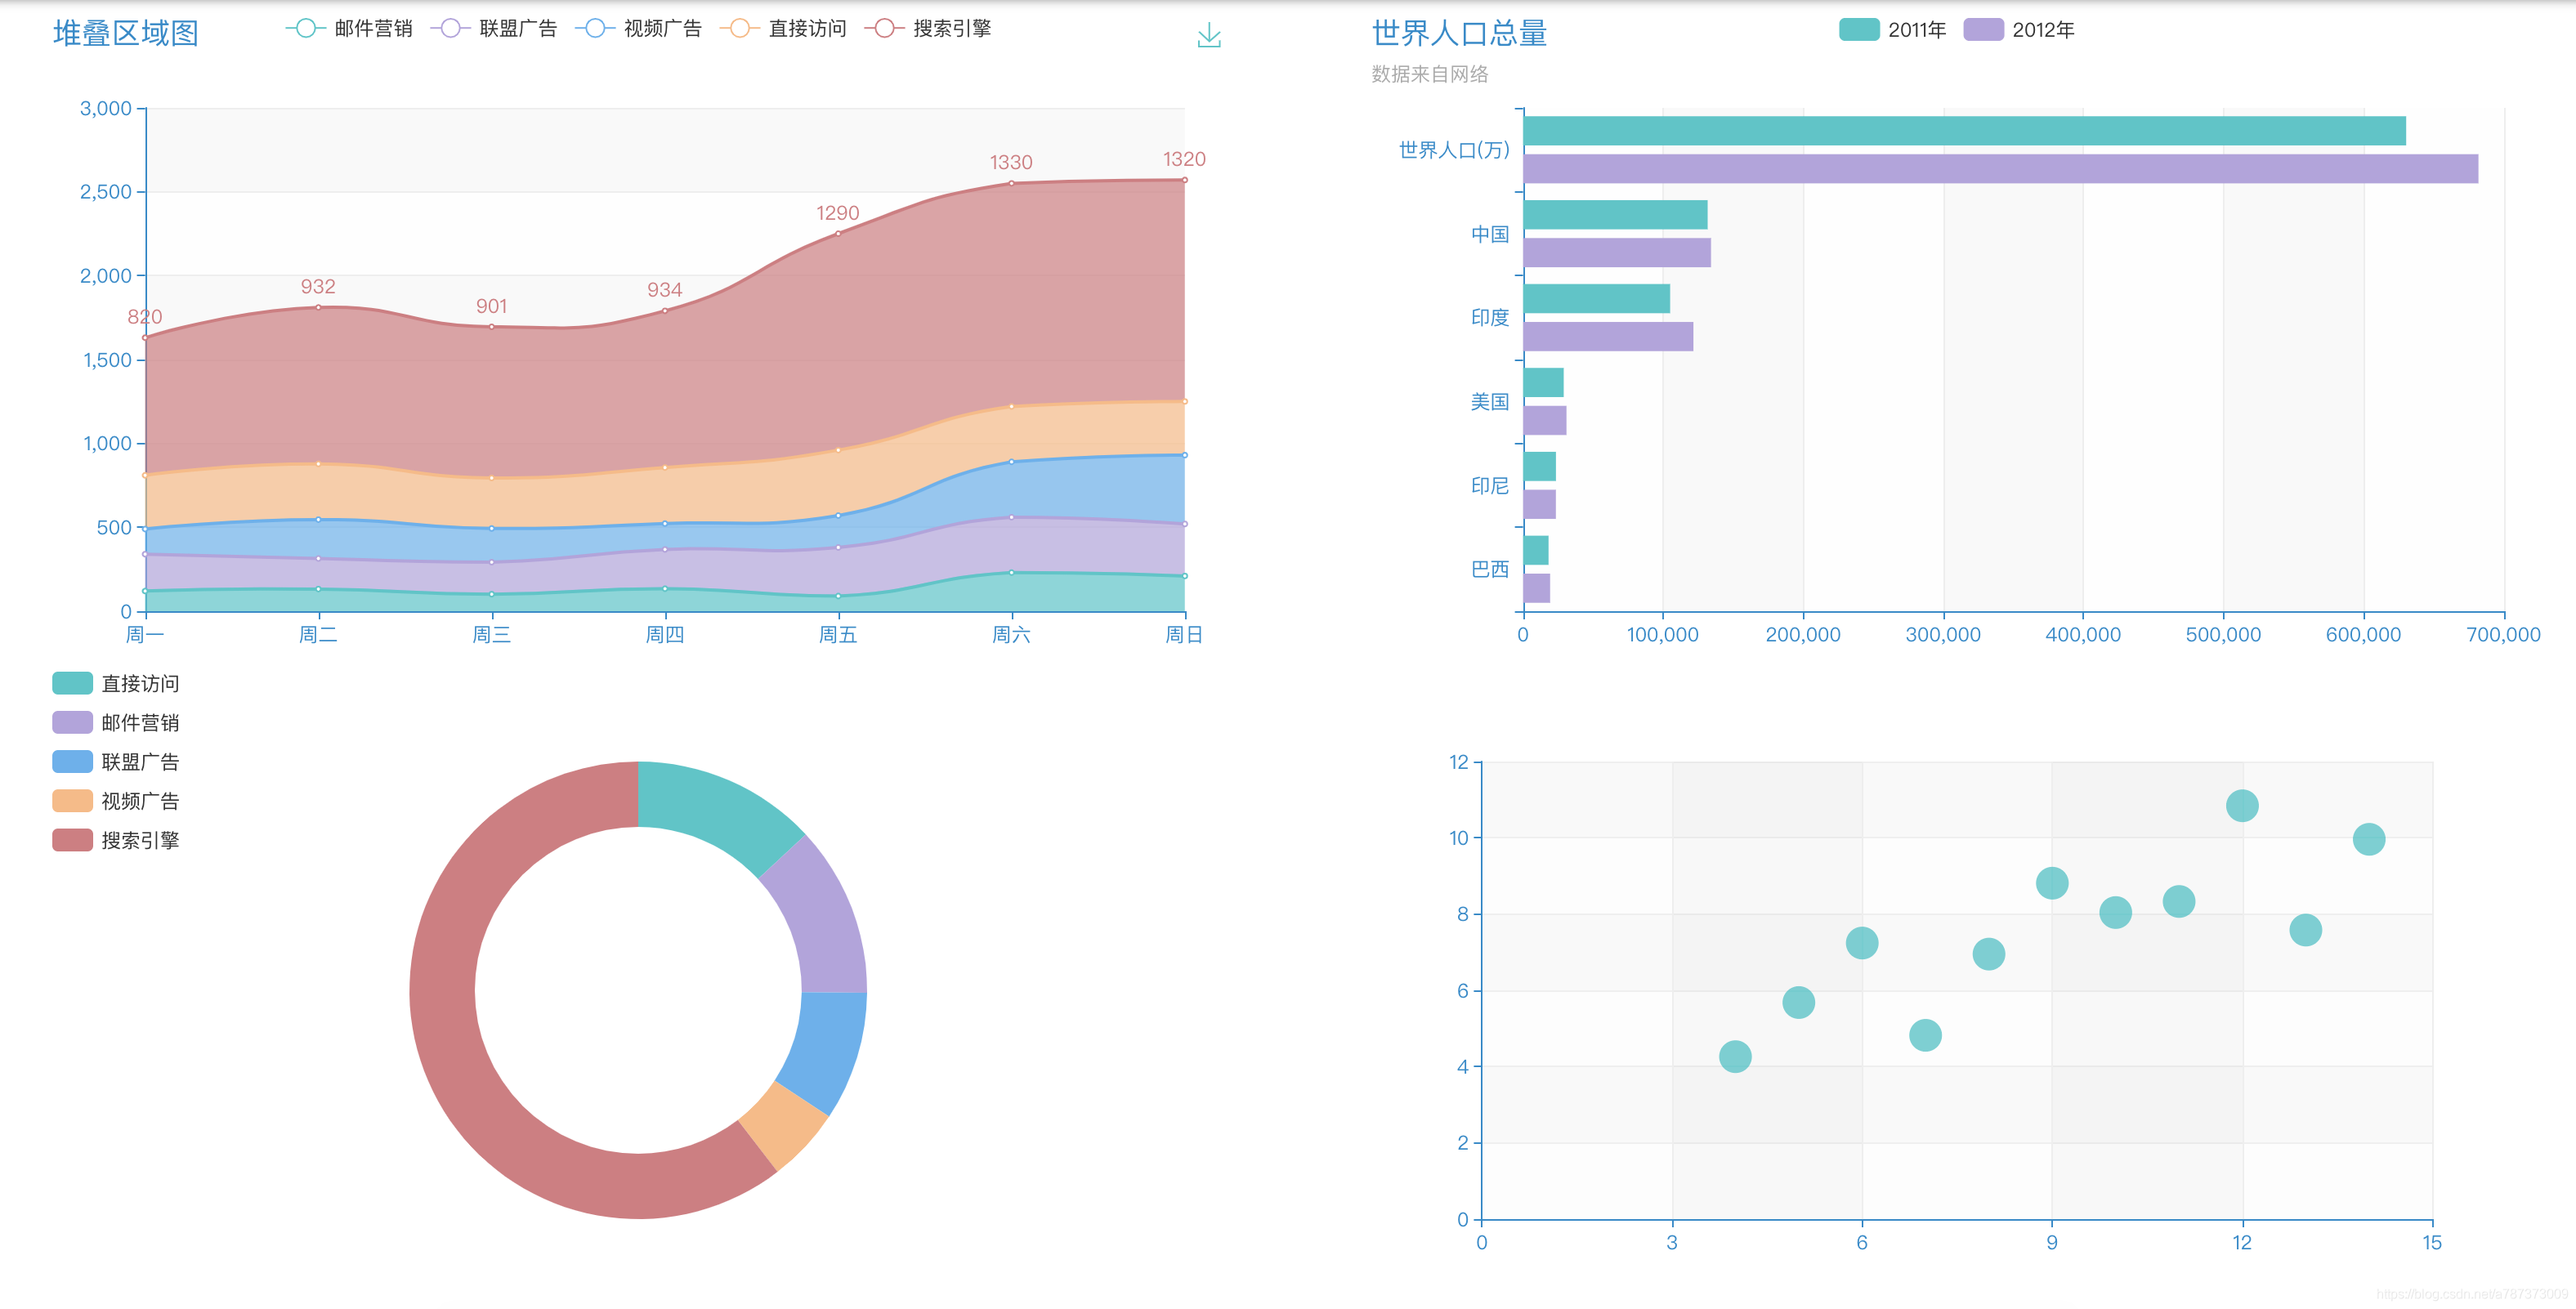
效果图
安装
npm install echarts
使用方式
let echarts = require('echarts/lib/echarts')
import 'echarts/theme/macarons.js'

export default {
  name: 'echarts_index',
  data: () => ({
    draw_line_view: null,
    draw_line_options: {
      title: {
        text: '堆叠区域图'
      },
      tooltip: {
        trigger: 'axis',
        axisPointer: {
          type: 'cross',
          label: {
            backgroundColor: '#6a7985'
          }
        }
      },
      legend: {
        data: ['邮件营销', '联盟广告', '视频广告', '直接访问', '搜索引擎']
      },
      toolbox: {
        feature: {
          saveAsImage: {}
        }
      },
      grid: {
        left: '3%',
        right: '4%',
        bottom: '3%',
        containLabel: true
      },
      xAxis: [
        {
          type: 'category',
          boundaryGap: false,
          data: ['周一', '周二', '周三', '周四', '周五', '周六', '周日']
        }
      ],
      yAxis: [
        {
          type: 'value'
        }
      ],
      series: [
        {
          name: '邮件营销',
          type: 'line',
          stack: '总量',
          areaStyle: {},
          data: [120, 132, 101, 134, 90, 230, 210]
        },
        {
          name: '联盟广告',
          type: 'line',
          stack: '总量',
          areaStyle: {},
          data: [220, 182, 191, 234, 290, 330, 310]
        },
        {
          name: '视频广告',
          type: 'line',
          stack: '总量',
          areaStyle: {},
          data: [150, 232, 201, 154, 190, 330, 410]
        },
        {
          name: '直接访问',
          type: 'line',
          stack: '总量',
          areaStyle: {normal: {}},
          data: [320, 332, 301, 334, 390, 330, 320]
        },
        {
          name: '搜索引擎',
          type: 'line',
          stack: '总量',
          label: {
            normal: {
              show: true,
              position: 'top'
            }
          },
          areaStyle: {normal: {}},
          data: [820, 932, 901, 934, 1290, 1330, 1320]
        }
      ]
    },
  }),
  methods: {
    draw_view(view, id, options) {
      if (view) {
        view.dispose();
      }
      view = document.getElementById(id) && echarts.init(document.getElementById(id), 'macarons');
      view && view.setOption(options);
    },

    draw_echarts_line_view() {
      this.draw_view(this.draw_line_view, "draw_line_view_id", this.draw_line_options)
    },
  },
  mounted() {
    this.draw_echarts_line_view()
  },
  render(h) {
    return h('div', {
      staticClass: 'items-center text-center col-grow q-pa-sm'
    }, [
      h('div', {
        attrs: {id: 'draw_line_view_id'},
        style: {
          height: '400px',
          width: '45%',
          margin: '0 auto'
        }
      }),
    ])
  }
}
事件列表
插件地址:echarts