1,效果图1
<div style="height:500px;">
<div id="ec2" style="height: 98%;padding: 15px;"></div>
</div>
<script>
var dom2 = document.getElementById("ec2");
var myChart2 = echarts.init(dom2);
option2 = null;
option2 = {
tooltip: {
trigger: 'item',
formatter: " {b}:{c} "
},
color:['#D06052','#E29F39','#4C9BC7'], //环形颜色
graphic:{ //图形中间文字
type:"text",
left:"center",
top:"center",
style:{
text:"66",
textAlign:"center",
fill:"#fff",
fontSize:60
}
},
series: [
{
name: '',
type: 'pie',
radius: ['30%', '50%'], //饼图大小
labelLine: { //图形外文字线
normal: {
length: 35,
length2:80
}
},
label: {
normal: {
formatter: '{c|{c}%} \n {b|{b}}', //图形外文字上下显示
borderWidth: 20,
borderRadius: 4,
padding: [0, -70], //文字和图的边距
rich: {
a: {
color: '#333',
fontSize: 16,
lineHeight: 30
},
b: { //name 文字样式
fontSize: 16,
lineHeight: 30,
color: '#CDCDD0',
},
c: { //value 文字样式
fontSize: 16,
lineHeight: 30,
color: '#63BF6A',
align:"center"
}
}
}
},
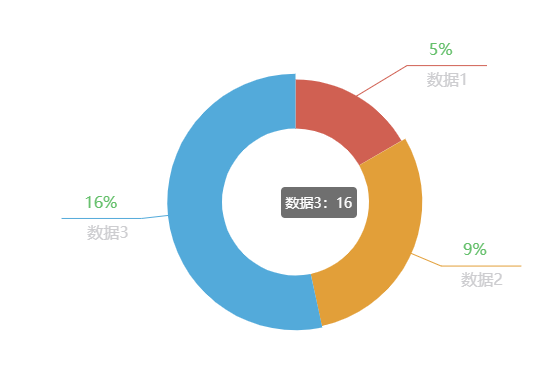
data: [
{value: 5, name: '数据1'},
{value: 9, name: '数据2'},
{value: 16, name: '数据3'}
]
}
]
};
if (option2 && typeof option2 === "object") {
myChart2.setOption(option2, true);
}
</script>