无监督学习
相对监督学习(输入进x,有对应的y),没有标注
聚类
- k均值
- 基于密度的聚类
- 最大期望聚类
降维
- 潜语义分析(LSA)
- 主成分分析(PCA)
- 奇异值分解(SVD)
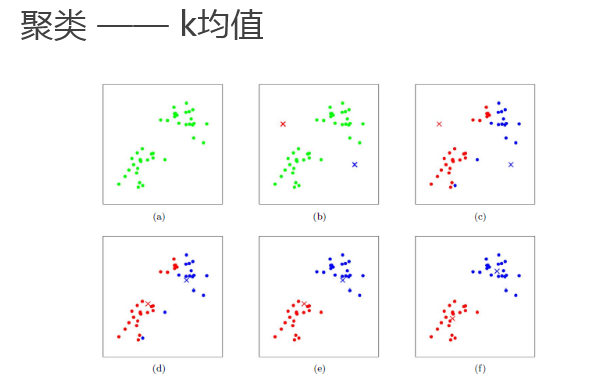
k 均值(k-means)是聚类算法中最为简单、高效的,属于无监督学习算法
核心思想:由用户指定k个初始质心(initial centroids),以作为聚类的类别(cluster),重复迭代直至算法收敛
基本算法流程:
- 选取k个初始质心(作为初始cluster);
- repeat:
    对每个样本点,计算得到距其最近的质心,将其类别标为该质心所对应的cluster;
    重新计算k个cluser对应的质心;
until 质心不再发生变化或迭代达到上限
kmeans代码实现
import numpy as np
import matplotlib.pyplot as plt

# 从sklearn中直接生成聚类数据
from sklearn.datasets.samples_generator import make_blobs
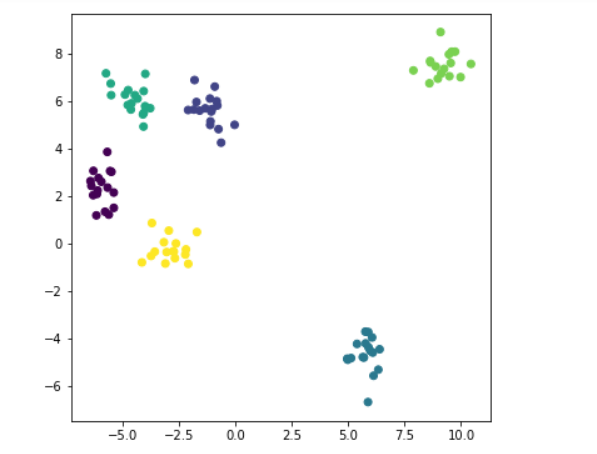
加载数据
x, y = make_blobs( n_samples=100, centers=6, random_state=1234, cluster_std=0.6 )
#100个样本,centers生成的样本中心(类别)数; random_state --seed used by the random number generator;
#cluster_std为每个类别设置不同的方差
#x.shape #(100, 2)
plt.figure(figsize=(6,6))
plt.scatter(x[:,0], x[:,1], c=y)  #c=y 6类,变得有颜色
plt.show()
算法实现
# 引入scipy中的距离函数,默认计算欧式距离
from scipy.spatial.distance import cdist

class K_Means(object):
    # 初始化,参数 n_clusters(K)、迭代次数max_iter、初始质心 centroids
    def __init__(self, n_clusters=5, max_iter=300, centroids=[]):
        self.n_clusters = n_clusters
        self.max_iter = max_iter
        self.centroids = np.array( centroids, dtype=np.float )

    # 训练模型方法,k-means聚类过程,传入原始数据
    def fit(self, data):
        # 假如没有指定初始质心,就随机选取data中的点作为初始质心
        if( self.centroids.shape == (0,) ):
            # 从data中随机生成0到data行数的6个整数,作为索引值
            self.centroids = data[ np.random.randint( 0, data.shape[0], self.n_clusters ) ,: ]

        # 开始迭代
        for i in range(self.max_iter):
            # 1. 计算距离矩阵,得到的是一个100*6的矩阵
            distances = cdist(data, self.centroids)

            # 2. 对距离按有近到远排序,选取最近的质心点的类别,作为当前点的分类
            c_ind = np.argmin( distances, axis=1 ) #axis=1保留最近一列

            # 3. 对每一类数据进行均值计算,更新质心点坐标
            for i in range(self.n_clusters ):
                # 排除掉没有出现在c_ind里的类别
                if i in c_ind:
                    # 选出所有类别是i的点,取data里面坐标的均值,更新第i个质心
                    #data[c_ind==i]布尔索引,拿到为true的值
                    self.centroids[i] = np.mean( data[c_ind==i], axis=0 )

    # 实现预测方法
    def predict(self, samples):
        # 跟上面一样,先计算距离矩阵,然后选取距离最近的那个质心的类别
        distances = cdist(samples, self.centroids)
        c_ind = np.argmin( distances, axis=1 )

        return c_ind
##测试下,二维数组5 * 4(4个质心点),行数代表有几个点,一行数是跟每一个质心的距离
dist = np.array([[121,221,32,43],
                [121,1,12,23],
                [65,21,2,43],
                [1,221,32,43],
                [21,11,22,3],])
c_ind = np.argmin( dist, axis=1 )
print(c_ind) #每一个元素跟哪一类最近 [2 1 2 0 3]
x_new=x[0:5]
print(x_new)#
print(c_ind==2) #[ True False  True False False]
print(x_new[c_ind==2])
np.mean(x_new[c_ind==2], axis=0) #每一个坐标每一列对应的平均值
----->>
[2 1 2 0 3]
[[-0.02708305  5.0215929 ]
 [-5.49252256  6.27366991]
 [-5.37691608  1.51403209]
 [-5.37872006  2.16059225]
 [ 9.58333171  8.10916554]]
[ True False  True False False]
[[-0.02708305  5.0215929 ]
 [-5.37691608  1.51403209]]
Out[14]:
array([-2.70199956,  3.26781249])
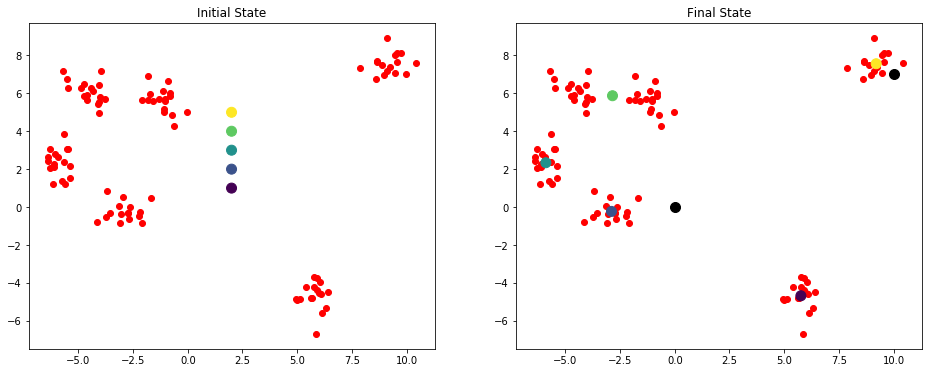
测试
# 定义一个绘制子图函数
def plotKMeans(x, y, centroids, subplot, title):
    # 分配子图,121表示1行2列的子图中的第一个
    plt.subplot(subplot)
    plt.scatter(x[:,0], x[:,1], c='r')
    # 画出质心点
    plt.scatter(centroids[:,0], centroids[:,1], c=np.array(range(5)), s=100)
    plt.title(title)
#centroids指定初始点
kmeans = K_Means(max_iter=300, centroids=np.array([[2,1],[2,2],[2,3],[2,4],[2,5]]))

plt.figure(figsize=(16, 6))
#初始状态的图
plotKMeans( x, y, kmeans.centroids, 121, 'Initial State' )

# 开始聚类
kmeans.fit(x)

plotKMeans( x, y, kmeans.centroids, 122, 'Final State' )

# 预测新数据点的类别
x_new = np.array([[0,0],[10,7]])
y_pred = kmeans.predict(x_new)

print(kmeans.centroids)
print(y_pred)

plt.scatter(x_new[:,0], x_new[:,1], s=100, c='black')

---->>
[[ 5.76444812 -4.67941789]
 [-2.89174024 -0.22808556]
 [-5.89115978  2.33887408]
 [-2.8455246   5.87376915]
 [ 9.20551979  7.56124841]]
[1 4]