背景:想让折线图跟柱形图混合显示,当然其实利用echarts的图形切换功能,可以很容易的实现,比如下边的这个代码
toolbox: {
top:0,
feature: {
//点击图表可直接将柱形图与折线图进行切换
}
},
但是当你有五六个图形,还要切换图形的时候要实现就要多写一些代码了,接下来教你,用legend切换还能折柱混合。
option = {
title: {
left: 'left',
text: '概率',
show:false
},
tooltip: {
trigger: 'axis',
formatter:'{a}:{c}',
axisPointer: {
type: 'cross',
crossStyle: {
color: '#999'
}
}
},
grid: {
show:false,
top:'30',
bottom:'60',
right:'60',
left:'60'
},
legend: {
show:true,
selectedMode:'single', //设置显示单一图例的图形,点击可切换
bottom:10,
left:50,
textStyle:{
color:'#666',
fontSize:12
},
itemGap:20,
data:['设备一','设备二','设备三'],
inactiveColor:'#ccc'
},
xAxis: [
{
type: 'category',
data: ['济南', '青岛', '烟台', '威海', '潍坊', '东营', '日照',
'滨州','莱芜','淄博','德州','聊城','临沂','泰安','菏泽','济宁','枣庄'],
axisPointer: {
type: 'shadow'
},
axisTick: {
show:true,
interval: 0
},
],
//设置两个y轴,左边显示数量,右边显示概率
yAxis: [{
type: 'value',
name: '数量',
show:true,
interval: 50,
},
{
type: 'value',
name: '概率',
min: 0,
max: 100,
interval: 10,
axisLabel: {
formatter: '{value} %'
}
}
],
//每个设备分数量、概率2个指标,只要让他们的name一致,即可通过,legeng进行统一的切换
series: [{
name:'设备一',
type:'bar',
data:[900,800,700,680,650,640,600,570,680,650,640,600,570,
450,400,380,300],
barWidth : '50%',
},
{
name:'设备一',
type:'line',
yAxisIndex: 1, //这里要设置哪个y轴,默认是最左边的是0,然后1,2顺序来。
data:[75,65,85,66,45,55,56,42,78,69,70,36,42,50,65,75,80],
symbolSize:10,
itemStyle:{
normal:{
color:"#DDA0DD"
}
}
},
{
name:' 设备二 ',
type:'bar',
data:[700,680,650,640,600,570,680,650,640,600,570,
450,400,380,300,900,800],
barWidth : '50%',
},
{
name:' 设备二 ',
type:'line',
yAxisIndex: 1,
data:[75,65,85,66,45,55,56,42,78,69,70,36,42,50,65,75,80],
symbolSize:10,
itemStyle:{
normal:{
color:"#87CEFA"
}
}
},
{
name:' 设备三 ',
type:'bar',
data:[600,570,680,650,640,600,570,
450,400,380,300,900,800,700,680,650,640,],
barWidth : '50%',
},
{
name:'设备三',
type:'line',
yAxisIndex: 1,
data:[75,65,85,66,45,55,56,42,78,69,70,36,42,50,65,75,80],
symbolSize:10,
itemStyle:{
normal:{
color:"#CD5C5C"
}
}
}
]
};
//看下图形样式
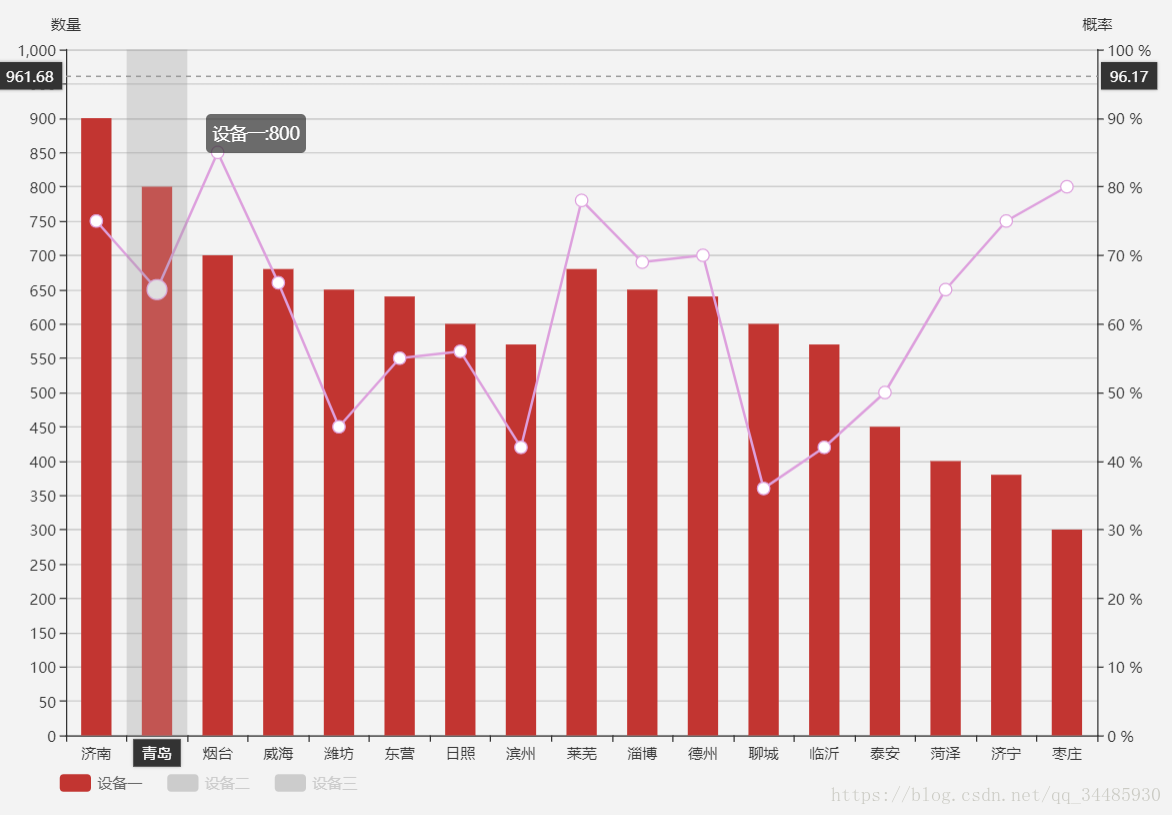

个人观点,欢迎指正
本人原创,非本人允许禁止转载