目录
一、效果图预览
 二、准备
二、准备
1.JavaScript源码运行文件,用以运行代码
需要运行文件的自行下载
http://链接:https://pan.baidu.com/s/1shmtM36HgRqC0S1OXpNWpg?pwd=yozs提取码:yozs --来自百度网盘超级会员V2的分享
https://pan.baidu.com/s/1shmtM36HgRqC0S1OXpNWpg?pwd=yozs
2.需要文本编辑器如notepad++
好用的文本编辑器能够使编辑和查错更方便,当然也可以用记事本进行编辑。
三、编写图像属性代码
1.编辑界面预览
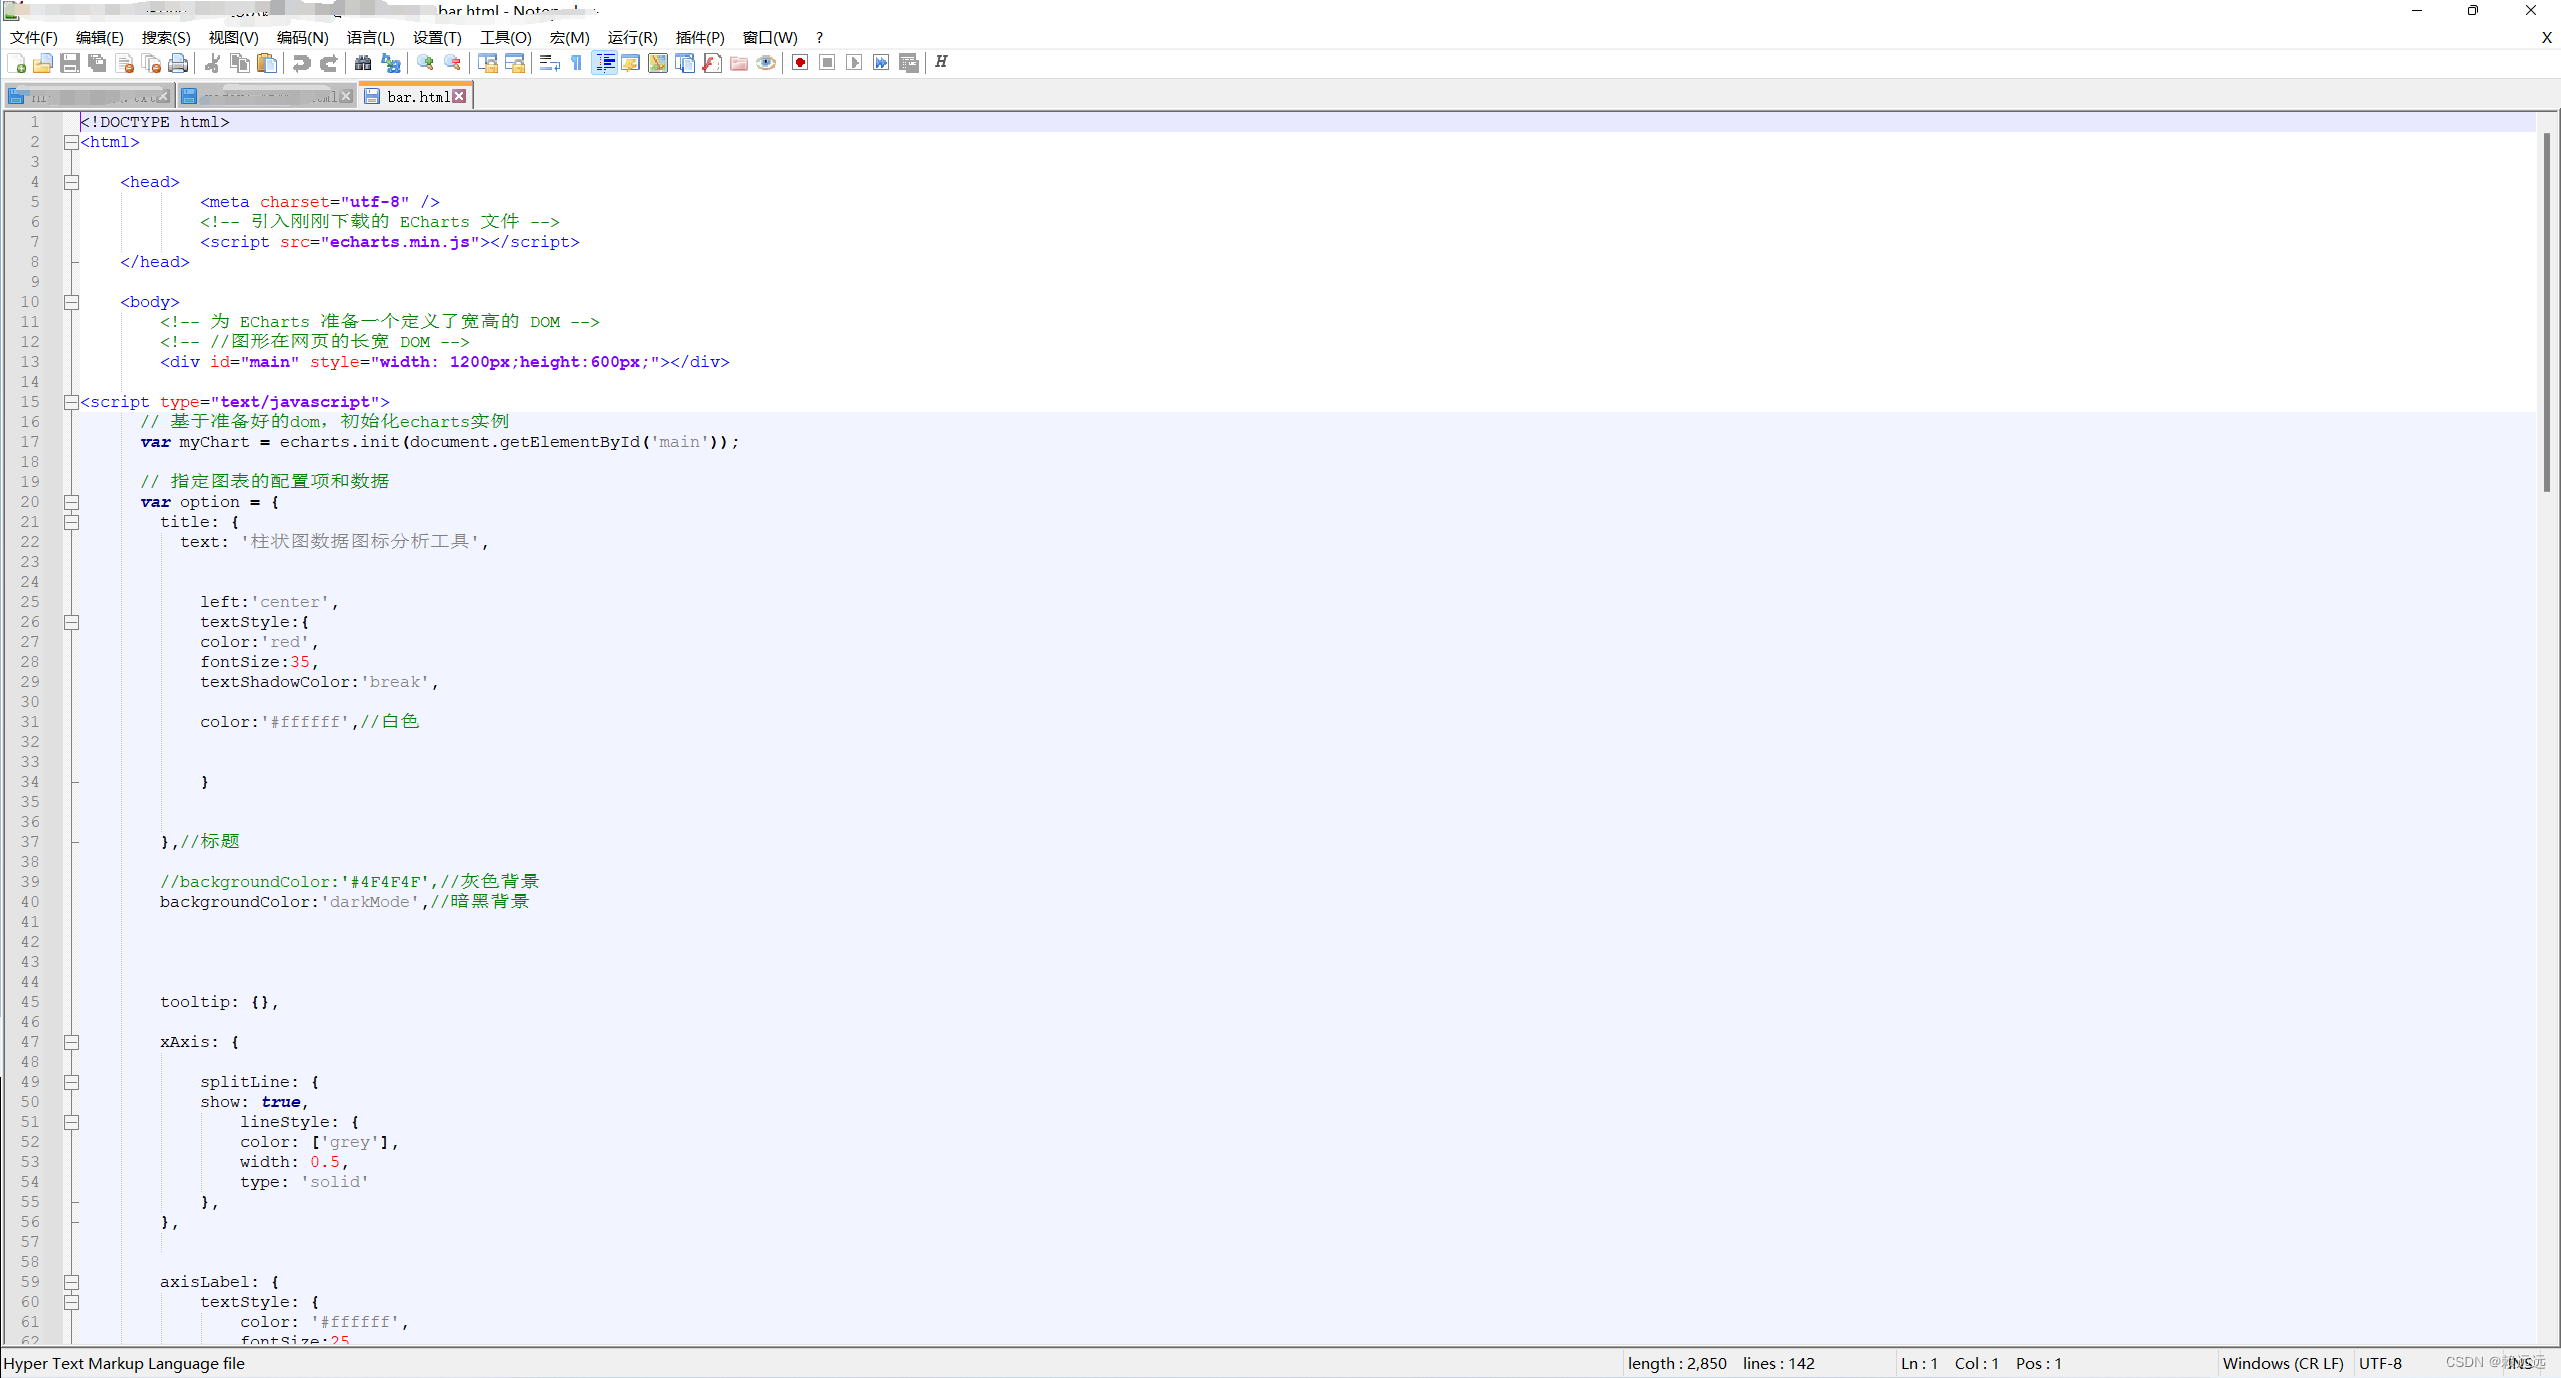
2.完整代码
<!DOCTYPE html>
<html>

	<head>
    		<meta charset="utf-8" />
    		<!-- 引入刚刚下载的 ECharts 文件 -->
    		<script src="echarts.min.js"></script>
  	</head>

		<body>
			<!-- 为 ECharts 准备一个定义了宽高的 DOM -->
			<!-- //图形在网页的长宽 DOM -->
			<div id="main" style="width: 1200px;height:600px;"></div>

			<script type="text/javascript">
			  // 基于准备好的dom,初始化echarts实例
			  var myChart = echarts.init(document.getElementById('main'));

			  // 指定图表的配置项和数据
			  var option = {
				title: {
				  text: '柱状图数据图标分析工具',


					left:'center',
					textStyle:{
					color:'red',
					fontSize:35,
					textShadowColor:'break',

					color:'#ffffff',//白色


					}


				},//标题

				//backgroundColor:'#4F4F4F',//灰色背景
				backgroundColor:'darkMode',//暗黑背景


				tooltip: {},

				xAxis: {

					splitLine: {
					show: true,
						lineStyle: {
						color: ['grey'],
						width: 0.5,
						type: 'solid'
					},
				},


				axisLabel: {
					textStyle: {
						color: '#ffffff',
						fontSize:25,

					},
				},


				axisTick:{
						 show:false,
					  },
				  data: ['数据1', '数据2', '数据3', '数据4', '数据5', '数据6', '数据7']
				},//

				yAxis: {

					/*name:'商品销量',
					type:'category',
					axisLine :{
						show:true,//显示y轴线
						symbol:['none','arrow'],//y轴箭头
						},*/
					splitLine: {
						show: true,
						lineStyle: {
						color: ['grey'],
						width: 0.5,
						type: 'solid'
					},
				},

					interval:10,//y轴数值距离
					axisLabel: {
						inside:false,
						textStyle: {
							color: '#ffffff',
							fontSize:12,
							itemSize:'',
					},
				},


					},


				series: [
				  {
					//name: '二月销量',
					type: 'effectScatter',
					type:'bar',
					data: [80, 75, 68, 65, 80,72, 97],
					itemStyle: {
						normal: {
		        //这里是重点
						color: function(params) {
							//注意,如果颜色太少的话,后面颜色不会自动循环,最好多定义几个颜色
							var colorList = ['#0072E3','#FF359A', '#EAC100', '#82D900', '#00FFFF','#97CBFF', '#A6A6D2'];
							return colorList[params.dataIndex]
								}
							}
						}
					},


		/*          {
					name: '三月销量',
					type: 'bar',
					data: [50, 30, 20, 40, 60, 80]
				  }*/


				]
			  };

			  // 使用刚指定的配置项和数据显示图表。
			  myChart.setOption(option);
			</script>

		</body>

</html>
编辑完成后需要保存为html文件,否则无法运行。
四、运行
注意:html文件需要和js文件在同一个目录下,否则图像代码编辑当中引入ECharts文件时就需要指定路径。
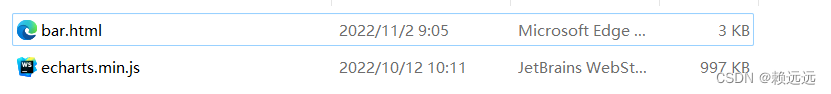
浏览器打开html文件即可查看运行结果。
想要了解和学习更多图形配置项可浏览Echarts官网
https://echarts.apache.org/zh/option.html#title
最后,如果内容对你有帮助,不妨点个赞!!