软件质量平台中需要输出各种各样的图表数据,以 v-charts 中的饼图为例,记录图表使用实现过程。
v-charts :https://github.com/ElemeFE/v-charts
docs :https://v-charts.js.org/#/
本文使用完全引用的方式,以 v-charts 实现饼图图表输出为例,演示步骤:
1、使用如下 npm 命令,进行 v-charts 安装
npm i v-charts echarts -S
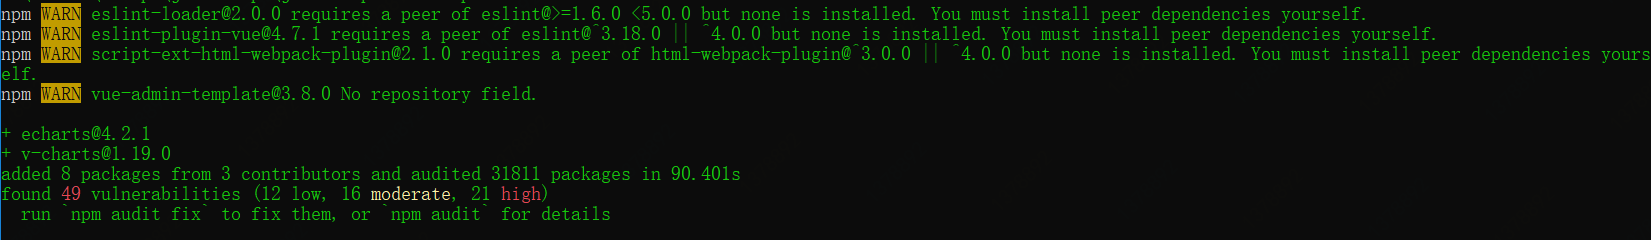
控制台输出如下所示:
2、在 main.js 中完全引入 v-charts,如下所示:
import VCharts from 'v-charts';

Vue.use(VCharts);
3、在对应的页面中使用 ve-pie 饼图元素,如下所示:
<ve-pie :data="chartData" :settings="chartSettings" ></ve-pie>
4、配置饼图的基本设置,如下所示:
  data() {
    return {
      chartSettings: { type: 'pie' },
      chartData: {
        columns: ['key', 'value'],
        rows: []
      }
    };
  }
5、在获取数据后,绑定饼图的数据源 chartData.rows,使得每次更新数据后,即可及时更新饼图信息,如下所示:
getSuiteResultStatusPieData() {
  this.listLoading = true;

  this.reportApi.getSuiteResultStatusPieData(this.form).then(res => {
    this.chartData.rows = res.data.pie;
    this.listLoading = false;

    this.$message({
      type: 'success',
      message: res.data.msg
    });
  })
  .catch(e => {
    console.log(e);
  });
}
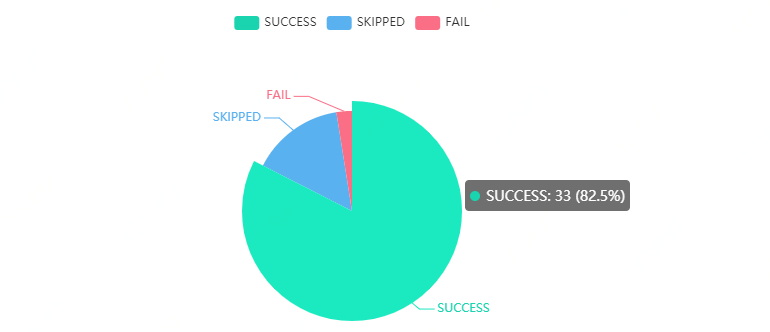
6、获取数据后,饼图展示如下所示: