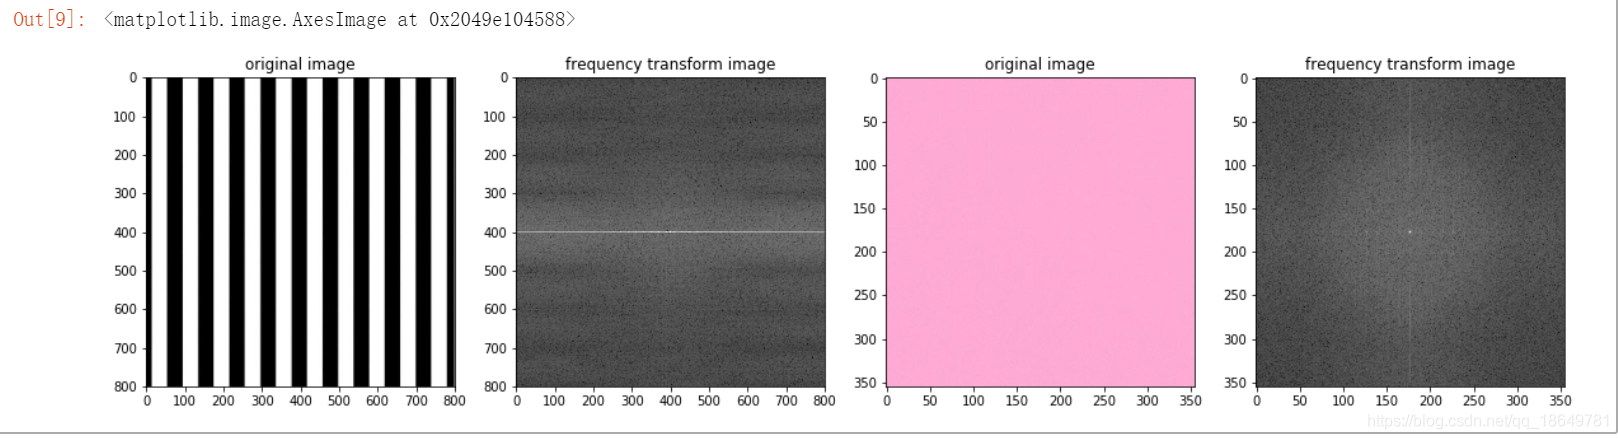
傅里叶变换 (FT) 是一个很重要的图像处理工具,用于将图像分解为频率组件。FT 的输出表 示频域内的图像,而输出图像等同于空间域 (x, y)。在频域图像中,每个点表示空间域中包 含的特定频率。因此,对于有很多高频组件(边缘、角落和条纹)的图像,频域中将有很多 点的频率值很高。
以下是傅里叶变换的代码:
import numpy as np
import matplotlib.pyplot as plt
import cv2
%matplotlib inline
#Read in the images
image_stripes = cv2.imread('images/stripes.jpg')
#Change color to RGB (from BGR)
image_stripes = cv2.cvtColor(image_stripes, cv2.COLOR_BGR2RGB)
#Read in the images
image_solid = cv2.imread('images/pink_solid.jpg')
#Change color to RGB (from BGR)
image_solid = cv2.cvtColor(image_solid, cv2.COLOR_BGR2RGB)
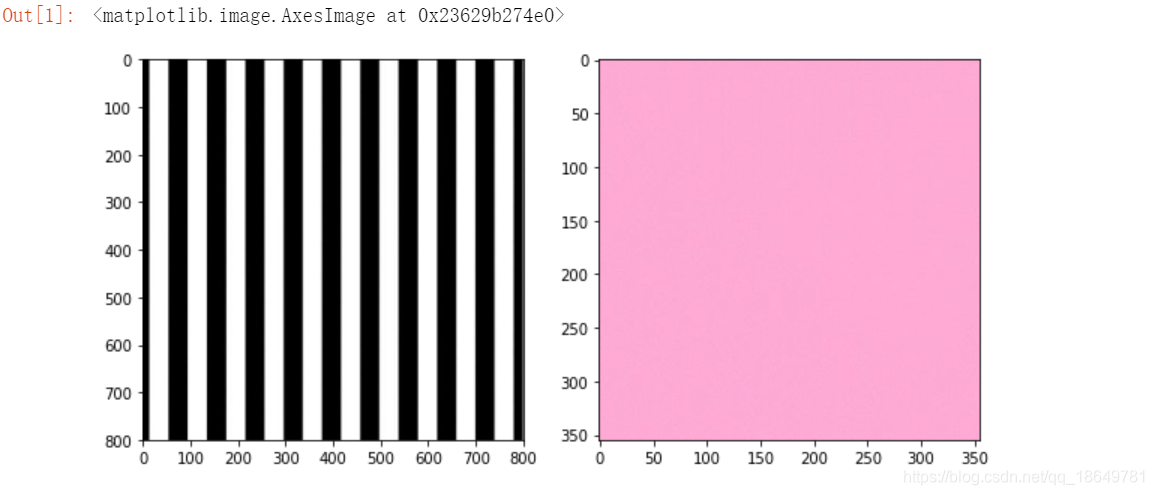
#Display the images
f, (ax1,ax2) = plt.subplots(1, 2, figsize=(10,5))
ax1.imshow(image_stripes)
ax2.imshow(image_solid)
#convert to grayscale to focus on the intensity patterns in the image
gray_stripes = cv2.cvtColor(image_stripes, cv2.COLOR_RGB2GRAY)
gray_solid = cv2.cvtColor(image_solid, cv2.COLOR_RGB2GRAY)

#normalize the image color values from a range of [0,255] to [0,1] for further processing
norm_stripes = gray_stripes/255.0
norm_solid = gray_solid/255.0

#perform a fast fourier transform and create a scaled, frequency transform image
def ft_image(norm_image):
    f = np.fft.fft2(norm_image)
    fshift = np.fft.fftshift(f)  ### 将结果转移到屏幕的中央
    frequency_tx = 20*np.log(np.abs(fshift)) ## 幅度谱的计算公式
    return frequency_tx
# Call the function on the normalized images
# and display the transforms
f_stripes = ft_image(norm_stripes)
f_solid = ft_image(norm_solid)

# display the images
# original images to the left of their frequency transform
f, (ax1,ax2,ax3,ax4) = plt.subplots(1, 4, figsize=(20,10))

ax1.set_title('original image')
ax1.imshow(image_stripes)
ax2.set_title('frequency transform image')
ax2.imshow(f_stripes, cmap='gray')

ax3.set_title('original image')
ax3.imshow(image_solid)
ax4.set_title('frequency transform image')
ax4.imshow(f_solid, cmap='gray')
原图:
效果图: