一、概况
一般大家都能会有个财富自由、时间自由的梦想。除了我们勤奋努力外,有些人运气比较好,买了一注彩票,瞬间会走上人生巅峰。彩票确实让有些人实现了这个梦想,但是这个概率太低了,低到无法想象。所以我们还是努力奋斗,做一个追梦人吧!
我们今天就爬取有史以来所有的双色球数据,看看这些年哪些数字出现的次数比较高。有的小伙伴可能不知道双色球是什么?双色球顾名思义就是两种颜色的球,一个红色,一个蓝色。红球从1-33中取出6个,篮球从1-16取出1个,如果你买的跟开奖号码一样,恭喜你几百万到手。
二、分析网站
我们今天准备爬取的网站叫500彩票(https://www.500.com/)
这个网站有很多彩票的开奖信息,我们找到全国开奖这个导航(https://kaijiang.500.com/)
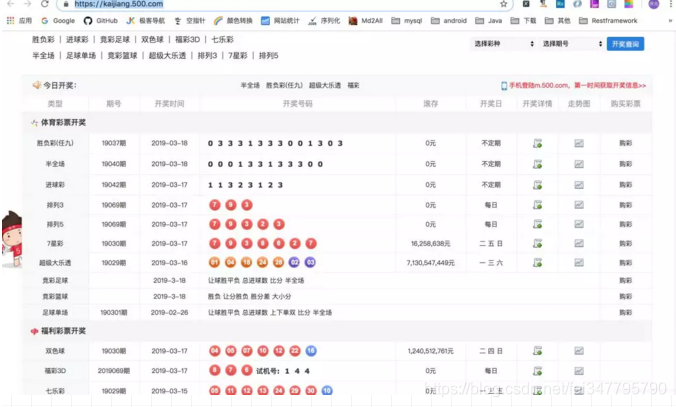
在这我们可以查询任何的彩票开奖信息:

我们选择双色球,并打开浏览器调试:
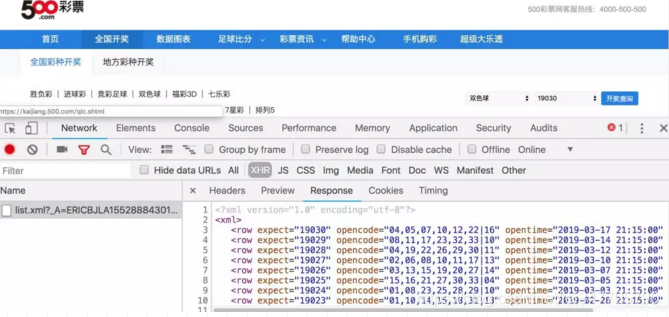
可以看出来是一个ajax(https://kaijiang.500.com/static/info/kaijiang/xml/ssq/list.xml?_A=ERICBJLA1552888430108)
请求,并且返回很多的xml信息。信息里面包括了有史以来所有双色球的开奖号码信息。数据有了,我们完全可以用正则表达式把我们想要的数据提取出来,然后保存到数据库。
三、逻辑实现
我们在本地先创建好数据库,我们要的信息只有三个:
-
红球
-
篮球
-
日期
代码比较简单:
'''
想要学习Python?Python学习交流群:984632579满足你的需求,资料都已经上传群文件,可以自行下载!
'''
1import requests
2import re
3import pymysql
4
5# 请求地址
6url = 'http://kaijiang.500.com/static/info/kaijiang/xml/ssq/list.xml?_A=BLWXUIYA1546584359929'
7
8# 数据库连接
9connection = pymysql.connect(host='localhost',
10 user='root',
11 password='123456',
12 db='db_shuangseqiu', )
13# 获取游标对象
14cursor = connection.cursor()
15
16# 请求头
17headers = {
18 'User-Agent': 'Mozilla/5.0 (Macintosh; Intel Mac OS X 10_11_2) AppleWebKit/537.36 (KHTML, like Gecko) Chrome/71.0.3578.98 Safari/537.36'
19}
20# 发起请求
21reponse = requests.get(url=url, headers=headers)
22
23# 正则规则
24pattern = re.compile(r'<row.*?opencode="(.*?)".*?opentime="(.*?)"')
25
26# 双色球数据
27ssq_data = pattern.findall(reponse.text)
28
29# ('10,11,12,13,26,28|11', '2003-02-23 00:00:00')
30for data in ssq_data:#处理数据
31 info, date = data
32 red, blue = info.split("|")
33
34 #插入数据
35 sql = """
36
37 INSERT INTO ssq_info(red,blue,date)values (%s,%s,%s)
38
39 """
40 try:
41 cursor.execute(sql, [red, blue, date])
42 connection.commit()
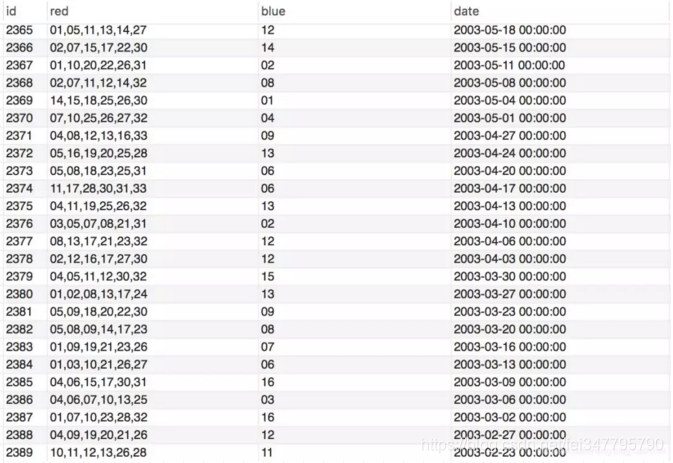
43 except Exception as e:
44 connection.rollback()从2003年第一个双色球开始,我们本地一共有2389条开奖数据。
四、统计
我们来统计一下这些年红球1-33出现的次数和篮球1-16出现的次数,通过matplotlib绘制成柱形统计图。在绘制前,我们得先从数据库中把红球和篮球出现的次数统计出来。
'''
想要学习Python?Python学习交流群:984632579满足你的需求,资料都已经上传群文件,可以自行下载!
'''
 1import pymysql
 2import matplotlib
 3matplotlib.use('TkAgg')
 4import matplotlib.pyplot as plt
 5import numpy as np
 6# 数据库连接
 7connection = pymysql.connect(host='localhost',
 8                             user='root',
 9                             password='123456',
10                       db='db_shuangseqiu', )
11# 获取游标对象
12cursor = connection.cursor()
13
14reds_count = [] #1-33红球所有个数
15blues_count = [] #1-16篮球所有个数
16
17def getdata():
18    sql = 'select * from ssq_info'
19    cursor.execute(sql)
20    results = cursor.fetchall()#获取全部数据
21
22    blues = []#所有红球个数
23    reds = []#所有篮球个数
24    for row in results :
25        red = row[1]
26        blue = row[2]
27        red_list = red.split(",")#把查询的红球进行以,分割 ["01","02","03","04","05","06"]
28
29        reds.extend(red_list)
30        blues.append(blue)
31
32    global reds_count,blues_count
33    #统计所有出现红球的个数
34    for i in range(1,34):
35        reds_count.append(reds.count(str(i).zfill(2)))
36
37    # 统计所有出现篮球的个数
38    for i in range(1,17):
39        blues_count.append(blues.count(str(i).zfill(2)))
40
41    # redstatistics()
42    # bluestatistics()
43
44#添加标签
45def autolabel(rects):
46    for rect in rects:
47        height = rect.get_height()
48        plt.text(rect.get_x()-rect.get_width()/4, 1.02*height, "%s" % int(height))
49
50#红球统计图
51def redstatistics():
52
53    width=0.35
54    index = np.arange(1, 34)
55    y = reds_count
56    y1 = np.array(y)
57    x1 = index + 1
58    fig = plt.figure()
59    ax1 = fig.add_subplot(111)
60    rect = ax1.bar(x1, y1, width, facecolor='#9999ff', edgecolor='white')
61    x = [str(i) for i in range(1,34)]
62    plt.xticks(index+1+width/20, x)
63    plt.ylim(0, 500)
64    autolabel(rect)
65
66    ax1.xaxis.set_ticks_position('bottom')
67    l1 = ax1.legend(loc=(.02,.92), fontsize=16)
68    plt.show()
69
70
71# 篮球统计图
72def bluestatistics():
73    width = 0.35
74    index = np.arange(1, 17)
75    y = blues_count
76    y1 = np.array(y)
77    x1 = index + 1
78    fig = plt.figure()
79    ax1 = fig.add_subplot(111)
80    rect = ax1.bar(x1, y1, width, facecolor='#9999ff', edgecolor='white')
81    x = [str(i) for i in range(1, 17)]
82    plt.xticks(index + 1 + width / 20, x)
83    plt.ylim(0, 500)
84    autolabel(rect)
85
86    ax1.xaxis.set_ticks_position('bottom')
87    l1 = ax1.legend(loc=(.02, .92), fontsize=16)
88    plt.show()
89
90
91if __name__ == '__main__':
92    getdata()
最后我们统计红球的柱形图统计图:
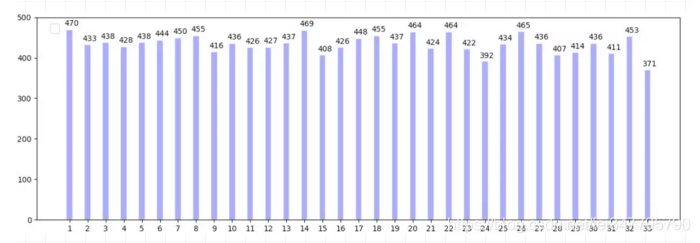
能看出来红球除了24和33,其余出现都超过了400次,出现次数还是比较平均的。
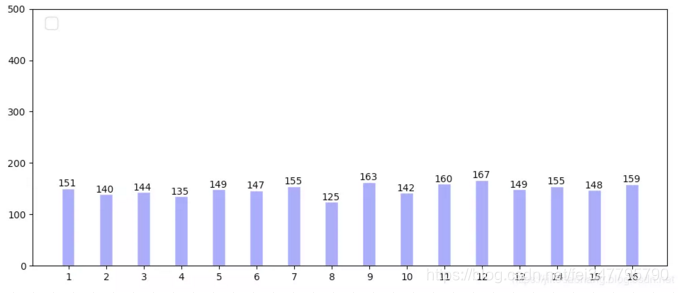
篮球就8出现的次数比较少一点,也看不出来什么门道。
五、总结
通过统计图也看不出来什么,双色球根本就是毫无规律可言。能学到的知识是爬虫和制图。所以基本靠双色球实现财富自由很难,但运气这种东西谁又说的好呢