从零开始学Python数据分析与挖掘之Python数据处理工具----Pandas
- 在做项目时最重要的就是准备数据,在准备数据过程中重要的一步就是数据清洗,数据清洗的工作一般包括,检查数据集是否存在重复,是否数据集中数据有缺失,数据是否具有完整性与一致性、数据之中是否有异常值
数据清洗之重复观测处理
# 数据读入
df = pd.read_excel('C:\\Users\\Administrator.SKY-20180518VHY\\Desktop\\shujufenxi\\第5章 Python数据处理工具--Pandas\\data_test04.xlsx')
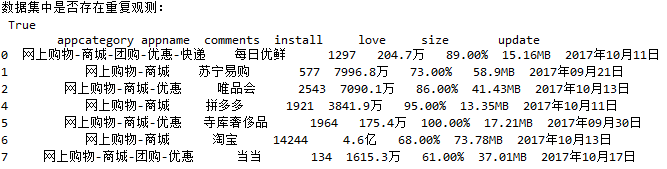
# 重复观测的检测
print('数据集中是否存在重复观测:\n',any(df.duplicated()))
# 删除重复项
df.drop_duplicates(inplace = True)
print(df)
数据清洗之缺失值处理
# 数据读入
df = pd.read_excel('C:\\Users\\Administrator.SKY-20180518VHY\\Desktop\\shujufenxi\\第5章 Python数据处理工具--Pandas\\data_test05.xlsx')
# 缺失观测的检测
print('数据集中是否存在缺失值:\n',any(df.isnull()))

删除法
# 删除法之记录删除
df.dropna()
# 删除法之变量删除
df.drop('age', axis = 1)
替换法
# 替换法之前向替换
df.fillna(method = 'ffill')
# 替换法之后向替换
df.fillna(method = 'bfill')
# 替换法之常数替换
df.fillna(value = 0)
# 替换法之统计值替换
df.fillna(value = {'gender':df.gender.mode()[0], 'age':df.age.mean(), 'income':df.income.median()})
插补法
…
数据清洗之异常值处理
# 数据读入
sunspots = pd.read_table('C:\\Users\\Administrator.SKY-20180518VHY\\Desktop\\shujufenxi\\第5章 Python数据处理工具--Pandas\\sunspots.csv',engine='python',sep = ',')
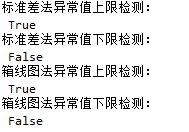
# 异常值检测之标准差法
xbar = sunspots.counts.mean()
xstd = sunspots.counts.std()
print('标准差法异常值上限检测:\n',any(sunspots.counts > xbar + 2 * xstd))
print('标准差法异常值下限检测:\n',any(sunspots.counts < xbar - 2 * xstd))
# 异常值检测之箱线图法
Q1 = sunspots.counts.quantile(q = 0.25)
Q3 = sunspots.counts.quantile(q = 0.75)
IQR = Q3 - Q1
print('箱线图法异常值上限检测:\n',any(sunspots.counts > Q3 + 1.5 * IQR))
print('箱线图法异常值下限检测:\n',any(sunspots.counts < Q1 - 1.5 * IQR))
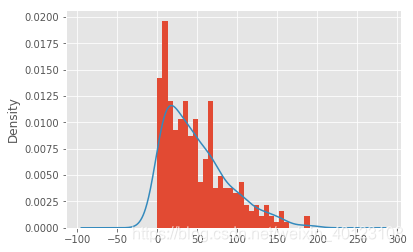
# 导入绘图模块
import matplotlib.pyplot as plt
# 设置绘图风格
plt.style.use('ggplot')
# 绘制直方图
sunspots.counts.plot(kind = 'hist', bins = 30, normed = True)
# 绘制核密度图
sunspots.counts.plot(kind = 'kde')
# 图形展现
plt.show()
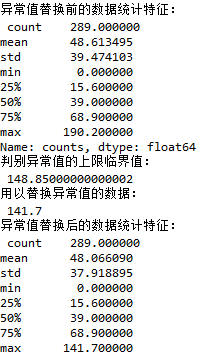
# 替换法处理异常值
print('异常值替换前的数据统计特征:\n',sunspots.counts.describe())
# 箱线图中的异常值判别上限
UL = Q3 + 1.5 * IQR
print('判别异常值的上限临界值:\n',UL)
# 从数据中找出低于判别上限的最大值
replace_value = sunspots.counts[sunspots.counts < UL].max()
print('用以替换异常值的数据:\n',replace_value)
# 替换超过判别上限异常值
sunspots.counts[sunspots.counts > UL] = replace_value
print('异常值替换后的数据统计特征:\n',sunspots.counts.describe())
Pandas之数据子集的获取
pandas取子集的方法有iloc、loc、ix三种方法,目前第三种方法ix已经被取代
import pandas as pd
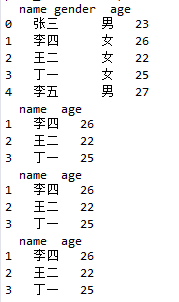
df1 = pd.DataFrame({'name':['张三','李四','王二','丁一','李五'],
'gender':['男','女','女','女','男'],
'age':[23,26,22,25,27]}, columns = ['name','gender','age'])
print(df1)
# 取出数据集的中间三行(即所有女性),并且返回姓名和年龄两列
print(df1.iloc[1:4,[0,2]])
print(df1.loc[1:3, ['name','age']])
print(df1.ix[1:3,[0,2]])
加入数据及没有行号,因该如何索引??如下例
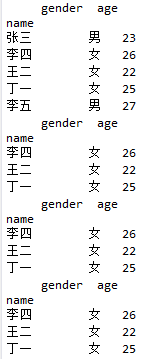
# 将员工的姓名用作行标签
df2 = df1.set_index('name')
print(df2)
# 取出数据集的中间三行
print(df2.iloc[1:4,:])
print(df2.loc[['李四','王二','丁一'],:])
print(df2.ix[1:4,:])
下面进行对条件进行索引筛选
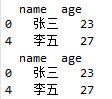
# 使用筛选条件,取出所有男性的姓名和年龄
# df1.iloc[df1.gender == '男',]#iloc函数在此处不可进行引用
print(df1.loc[df1.gender == '男',['name','age']])
print(df1.ix[df1.gender == '男',['name','age']])
注:来源刘顺祥《从零开始学Python数据分析与挖掘》,版权归原作者所有,仅供学习使用,不用于商业用途,如有侵权请留言联系删除,感谢合作。