版权声明:本文为博主原创文章,未经博主允许不得转载。 https://blog.csdn.net/u013817676/article/details/79051656
#image图片
#image data
a = np.array([0.313660827978, 0.365348418405, 0.423733120134,
              0.365348418405, 0.439599930621, 0.525083754405,
              0.423733120134, 0.525083754405, 0.651536351379]).reshape(3,3)
#interpolation的值:
#http://matplotlib.org/examples/images_contours_and_fields/interpolation_methods.html
#"origin"= ['upper', 'lower']:
#http://matplotlib.org/examples/pylab_examples/image_origin.html
plt.imshow(a,interpolation='nearest',cmap='bone')

#右边的bar
plt.colorbar(shrink=.9)

plt.xticks(())
plt.yticks(())
plt.show()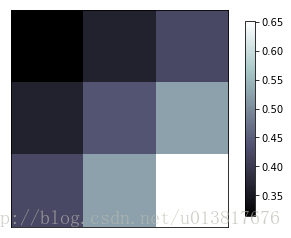
#3D
from mpl_toolkits.mplot3d import Axes3D

fig = plt.figure()
ax = Axes3D(fig)
#X,Y value
X = np.arange(-4,4,0.25)
Y = np.arange(-4,4,0.25)
X,Y = np.meshgrid(X,Y)
R = np.sqrt(X**2+Y**2)
#heigh value
Z = np.sin(R)
#row stride行的跨度,column stride列跨度,值越小,线越密集
ax.plot_surface(X,Y,Z,rstride=1,cstride=1,cmap=plt.get_cmap('rainbow'))

plt.show()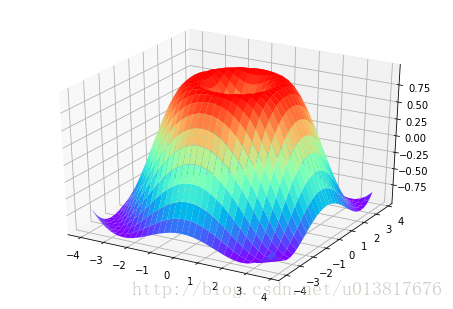
#画等高线
#zdir投影面,offset是投影面=offset值的面
ax.contourf(X,Y,Z,zdir='z',offset=-2,cmap='rainbow')
ax.set_zlim(-2,2)
plt.show()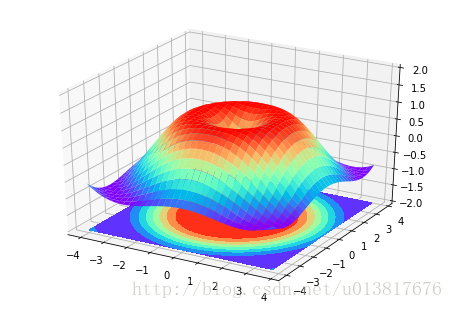
#subplot创建小图
plt.figure()
plt.subplot(2,2,1)
plt.plot([0,1],[0,1])

#no 2
plt.subplot(2,2,2)
plt.plot([0,1],[0,1])

#no 3
plt.subplot(2,2,3)
plt.plot([0,1],[0,1])

#no 4
plt.subplot(2,2,4)
plt.plot([0,1],[0,1])

plt.show()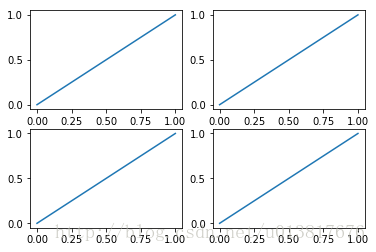
plt.subplot(2,1,1)
plt.plot([0,1],[0,1])

#no 2
plt.subplot(2,3,4)
plt.plot([0,1],[0,1])

#no 3
plt.subplot(2,3,5)
plt.plot([0,1],[0,1])

#no 4
plt.subplot(2,3,6)
plt.plot([0,1],[0,1])

plt.show()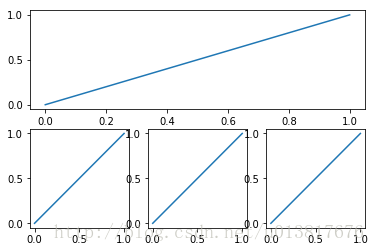
#分格显示
#方式一:subplot2grid
plt.figure()
#(3,3)三行三列,(0,0)起始点,colspan=3列跨三行
ax1 = plt.subplot2grid((3, 3), (0, 0), colspan=3)  # stands for axes
ax1.plot([1, 2], [1, 2])
ax1.set_title('ax1_title')
ax2 = plt.subplot2grid((3, 3), (1, 0), colspan=2)
ax3 = plt.subplot2grid((3, 3), (1, 2), rowspan=2)
ax4 = plt.subplot2grid((3, 3), (2, 0))
ax4.scatter([1, 2], [2, 2])
ax4.set_xlabel('ax4_x')
ax4.set_ylabel('ax4_y')
ax5 = plt.subplot2grid((3, 3), (2, 1))

plt.tight_layout()
plt.show()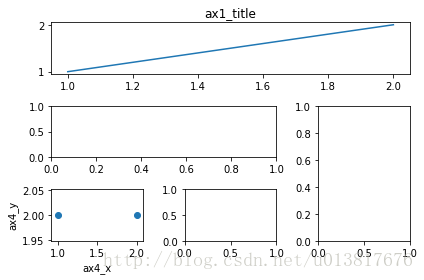
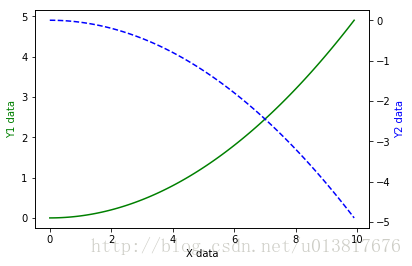
#主次坐标轴
x = np.arange(0, 10, 0.1)
y1 = 0.05 * x**2
y2 = -1 *y1

fig, ax1 = plt.subplots()

ax2 = ax1.twinx()    # 镜像反向Y1坐标轴
ax1.plot(x, y1, 'g-')
ax2.plot(x, y2, 'b--')

ax1.set_xlabel('X data')
ax1.set_ylabel('Y1 data', color='g')
ax2.set_ylabel('Y2 data', color='b')

plt.show()
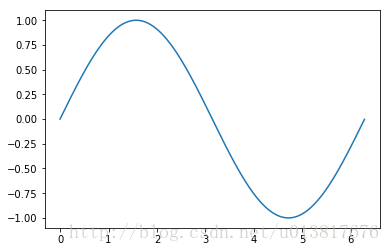
# animation 动画
from matplotlib import animation

fig,ax = plt.subplots()
x = np.arange(0,2*np.pi,0.01)
line, = ax.plot(x,np.sin(x))
def animate(i):
    line.set_ydata(np.sin(x+i/10))
    return line,

def init():
    line.set_ydata(np.sin(x))
    return line,

animation = animation.FuncAnimation(fig=fig,func=animate,frames=100,init_func=init,interval=20,blit=False)

plt.show()