http://echarts.baidu.com/tutorial.html#%E5%9C%A8%E5%BE%AE%E4%BF%A1%E5%B0%8F%E7%A8%8B%E5%BA%8F%E4%B8%AD%E4%BD%BF%E7%94%A8%20ECharts
http://www.echartsjs.com/examples/
1/官网上下载demo,把文件夹拷贝到小程序项目中。新建page
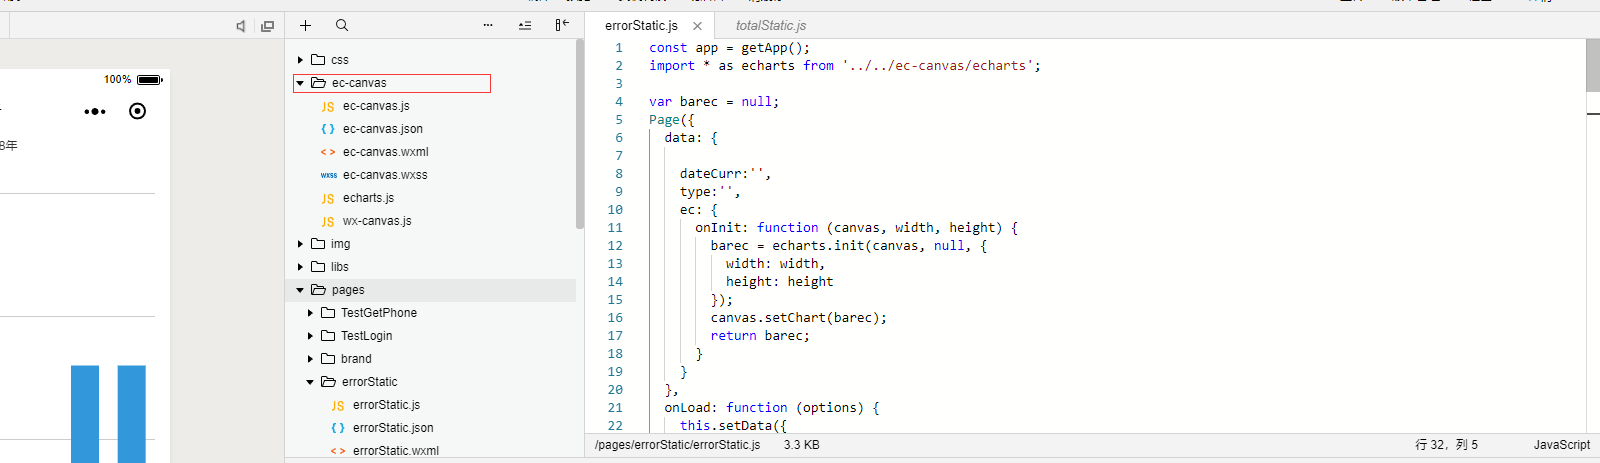
2 代码如下 errorStatic.js里面
const app = getApp();
import * as echarts from '../../ec-canvas/echarts';
var barec = null;
Page({
data: {
dateCurr:'',
type:'',
ec: {
onInit: function (canvas, width, height) {
barec = echarts.init(canvas, null, {
width: width,
height: height
});
canvas.setChart(barec);
return barec;
}
}
},
onLoad: function (options) {
this.setData({
dateCurr: options.id
})
app.globalData.type = options.type;
console.log(app.globalData.type);
},
onReady() {
setTimeout(this.getData, 500);
},
//getData方法里发送ajax
getData() {
wx.showLoading({
title: '加载中...',
})
wx.request({
url: '',
herder: {
"content-type": "json"
},
success: function (res) {
var names = []; //类别数组(实际用来盛放y轴坐标值)
var nums = []; //销量数组(实际用来盛放x坐标值)
// console.log(app.globalData.type);
var type = app.globalData.type;
var title = "";
if (type == 12) {
title = "客户端错误个数";
for (var i = 0; i < res.data.msg.length; i++) {
names.push(res.data.msg[i].LastTime.substring(0, 5)); //挨个取出类别并填入类别数组
}
for (var i = 0; i < res.data.msg.length; i++) {
nums.push(res.data.msg[i].ClientErrorCount); //挨个取出类别并填入类别数组
}
}
if (type == 13) {
title = "WEB端错误个数";
for (var i = 0; i < res.data.msg.length; i++) {
names.push(res.data.msg[i].LastTime.substring(0, 5)); //挨个取出类别并填入类别数组
}
for (var i = 0; i < res.data.msg.length; i++) {
nums.push(res.data.msg[i].WebErrorCount); //挨个取出类别并填入类别数组
}
}
barec.setOption({
color: ['#3398DB'],
title: {
text: title
},
tooltip: {
trigger: 'axis',
axisPointer: { // 坐标轴指示器,坐标轴触发有效
type: 'shadow' // 默认为直线,可选为:'line' | 'shadow'
}
},
legend: {
data: ['2018年']
},
grid: {
left: '3%',
right: '4%',
bottom: '5%',
containLabel: true
},
xAxis: [
{
name: '2018年',
type: 'category',
data: names,
axisTick: {
alignWithLabel: true
},
boundaryGap: true,
show: true,
axisLabel: {
interval: 0
}
}
],
yAxis: [
{
type: 'value'
}
],
series: [
{
name: '2018年',
type: 'bar',
barWidth: '60%',
data: nums
}
]
})
wx.hideLoading();
},
fail: function (res) { },
complete: function (res) { },
})
}
});
3/代码如下 errorStatic.json里面
{
"usingComponents": {
"ec-canvas": "../../ec-canvas/ec-canvas"
}
}
4.代码如下 errorStatic.wxml里面
<!--index.wxml-->
<view class="container">
<ec-canvas id="mychart-dom-bar" canvas-id="mychart-bar" ec="{{ ec }}"></ec-canvas>
</view>
4.代码如下 errorStatic.wxss里面
/**index.wxss**/
ec-canvas {
width: 100%;
height: 100%;
}
page {
">#fff;
}
.container {
">#fff;
}
.container {
position: absolute;
top: 0;
bottom: 0;
left: 0;
right: 0;
display: flex;
flex-direction: column;
align-items: center;
justify-content: space-between;
box-sizing: border-box;
}