The data that you analyze in Tableau is often made up of a collection of tables that are related by specific fields (that is, columns). Joining is a method for combining the related data on those common fields. The result of combining data using a join is a virtual table that is typically extended horizontally by adding columns of data.
Note: When joining tables, the fields that you join on must have the same data type. If you change the data type after you join the tables, the join will break.
For example, suppose you are analyzing data for a publisher. The publisher might have two tables. The first table contains ID numbers, first name, last name, and publisher type. The second table contains ID numbers, price, royalty, and title of published books. The related field between the two tables might be ID.
| Table 1
|
Table 2
|
In order to analyze these two tables together, you can join the tables on ID to answer questions like, "How much was paid in royalties for authors from a given publisher?". By combining tables using a join, you can view and use related data from different tables in your analysis.
| ID | First Name | Last Name | Publisher Type | Book Title | Price | Royalty |
| 20034 | Adam | Davis | Independent | The Magic Shoe Lace | 15.99 | 7,000 |
| 20165 | Ashley | Garcia | Big | Weather in the Alps | 19.99 | 5,000 |
Overview of join types
In general, there are four types of joins that you can use to combine your data in Tableau: inner, left, right, and full outer. The tables you can join and the different join types you can use depend on the database or file you connect to. You can tell which join types your data supports by checking the join dialog after you've connected to your data and have at least two tables on the canvas.
| Join Type | Result | Description |
| Inner | When you use an inner join to combine tables, the result is a table that contains values that have matches in both tables. |
 |
| Left | When you use a left join to combine tables, the result is a table that contains all values from the left table and corresponding matches from the right table. When a value in the left table doesn't have a corresponding match in the right table, you see a null value in the data grid. |
|
| Right | When you use a right join to combine tables, the result is a table that contains all values from the right table and corresponding matches from the left table. When a value in the right table doesn't have a corresponding match in the left table, you see a null value in the data grid. |
|
| Full outer | When you use a full outer join to combine tables, the result is a table that contains all values from both tables. When a value from either table doesn't have a match with the other table, you see a null value in the data grid. |
|
| Union | Though union is not a type of join, union is another method for combining two or more tables by appending rows of data from one table to another. Ideally, the tables that you union have the same number of fields, and those fields have matching names and data types. For more information about union, see Union Your Data. |  |


Combine tables from the same database
If the tables you need to analyze are from the same database, or workbook (for Excel), or directory (for text) then use the following procedure to combine tables. Combining tables that are from the same database require only a single connection in the data source. Typically, joining tables from the same database yields better performance. This is because querying data that is stored on the same database takes less time and leverages the native capabilities of the database to perform the join.
Note: Depending on the level of detail of the tables you want to combine, you might consider data blending instead. For more information, see Blend Your Data.
To join tables
-
In Tableau Desktop: on the start page, under Connect, click a connector to connect to your data. This step creates the first connection in the Tableau data source.
In web authoring: Select New Workbook and connect to your data. This step creates the first connection in the Tableau data source.
-
Select the file, database, or schema, and then double-click or drag a table to the canvas.

Note: If you're authoring on the web or signed in to Tableau Server (from Tableau Desktop) while you are setting up the data source, you have access to recommended tables to help make combining your data easier. For more information, see Use Certified and Recommended Data Sources and Tables.
-
Double-click or drag another table to the canvas, and then click the join relationship to add join clauses and select your join type.

-
Add one or more join clauses by selecting a field from one of the available tables used in the data source, a join operator, and a field from the added table. Inspect the join clause to make sure it reflects how you want to connect the tables.
For example, in a data source that has a table of order information and another for returns information, you could use an inner join to combine the two tables based on the Order ID field that exists in both tables.

Note: You can delete an unwanted join clauses by clicking the "x" that displays when you hover over the right side of the join clause.
-
When you are finished, close the Join dialog.
After you've created a join, review the data grid to make sure that the join produces the results that you expect. For more information, see Review join results in the data grid. To troubleshoot your join, see Troubleshoot joins.
Continue to prepare your data source for analysis. You can rename and reset fields, create calculations, clean your data with Data Interpreter, change the data types of fields, and so on.
About null values in join keys
In general, joins are performed at the database level. If the fields used to join tables contain null values, most databases return data without the rows that contain the null values. However, if you've set up your single-connection data source to use an Excel, text, or Salesforce connection, Tableau provides an additional option to allow you to join fields that contain null values with other fields that contain null values.
To join on null values
- After you've set up your data source, on the data source page, select Data > Join null values to null values.
For example, suppose you have two tables of data that you want to join: Orders_June and Orders_July.
| Orders_June | Orders_July | ||||||||||||||||
|
|
If you join on both the ID and Location fields, most databases return the following table of data:
Join (of Orders_June and Orders_July)
| ID | Location | ID(Orders_July) | Location (Orders_July) |
| 1 | New York | 1 | New York |
| 3 | Miami | 3 | Miami |
If you are using a single Excel, text, or Salesforce connection in your data source, select Data > Join null values to null values to return the following table:
Join (of Orders_June and Orders_July)
| ID | Location | ID(Orders_July) | Location (Orders_July) |
| 1 | New York | 1 | New York |
| 2 | null | 2 | null |
| 3 | Miami | 3 | Miami |
Note: This option is available for single-connection data sources that use text, Excel, and Salesforce connections. If you add a second connection to a data source that uses this option, the join reverts back to the default behavior of excluding rows with null values.
Combine tables from different databases
Beginning with Tableau version 10.0, if the tables you need to analyze are stored in different databases, or workbooks (for Excel), or directories (for text), use the following procedure to combine tables using a cross-database join.
Cross-database joins require that you first set up a multi-connection data source—that is, you create a new connection to each database before you join tables. When you connect to multiple databases, a data source becomes a multi-connection data source. Multi-connection data sources can be advantageous when you need to analyze data for an organization that uses different internal systems or when you need to work with data that is managed separately by both internal and external groups.
Note: In many cases, using a cross-database join is the primary method for combining your data. However, there are some cases that you might need to combine your data using data blending instead. For more information, see Blend Your Data.
After you've combined tables using a cross-database join, Tableau colors the tables in the canvas and the columns in the data grid to show you which connection the data comes from.
To join tables from different databases
-
In Tableau Desktop: On the Start page, under Connect, click a connector to connect to your data. This step creates the first connection in the Tableau data source.
In web authoring: Select New Workbook and connect to your data. This step creates the first connection in the Tableau data source.
-
Select the file, database, or schema, and then double-click or drag a table to the canvas.
-
In the left pane, under Connections, click the Add button (+ in web authoring) to add a new connection to the Tableau data source. A new connection is required if you have related data stored in another database.

Note: If the connector you want is not available from the Connect list, cross-database joins are not supported for the combination of sources that you want to join. This includes connections to cube data (e.g., Microsoft Analysis Services), most extract-only data (e.g., Google Analytics and OData), and Tableau Server data sources. Instead of joining tables, consider using data blending. For more information, see Blend Your Data.
-
Add one or more join clauses by selecting a field from one of the available tables used in the data source, a join operator, and a field from the added table. Inspect the join clause to make sure it reflects how you want to connect the tables.
For example, in a data source that has a table of order information and another table of returns information, you could join the two tables based on the Order ID field that exists in both tables. Select the type of join.

Note: You can delete an unwanted join clause by clicking the "x" that displays when you hover over the right-side of the join clause.
-
When you are finished, close the Join dialog box.
Tables and columns are colored to show you which connection the data comes from.

After you've created a cross-database join, continue to prepare your multi-connection data source for analysis. You can rename and reset fields, create calculations, clean your data with Data Interpreter, change the data types of fields, and so on.
To troubleshoot your join, see Troubleshoot joins.
About working with multi-connection data sources
Working with multi-connection data sources is just like working with any other data source, with a few caveats, discussed in this section.
Union data from within a connection
To union data, you must use text tables or Excel tables from the same connection. That is, you cannot union tables from different databases. In Tableau Desktop, you can union tables across different Excel workbooks and files in different folders. For more information, see the Union tables using wildcard search (Tableau Desktop).
If you need to union data from different databases, use Tableau Prep.
Collation
Collation refers to the rules of a database that determine how string values should be compared and sorted. In most cases, the collation is handled by the database. However, when you work with cross-database joins, you might join columns that have different collations.
For example, suppose your cross-database join used a join key comprised of a case-sensitive column from SQL Server and a case-insensitive column from Oracle. In cases like this, Tableau maps certain collations to others to minimize interpreting values incorrectly.
The following rules are used in cross-database joins:
-
If a column uses collation standards of the International Components for Unicode (ICU), Tableau uses the collation of the other column.
-
If all columns use collation standards of the ICU, Tableau uses the collation of the column of the left table.
-
If no columns use collation standards of the ICU, Tableau uses a binary collation. A binary collation means the locale of the database and data type of the columns determine how string values should be compared and sorted.
Note: Collation of Japanese characters, that is, Kana-sensitivity, depends on the database that you are connected to.
Calculations and multi-connection data sources
Only a subset of calculations can be used in a multi-connection data source.
In Tableau Desktop: You can use a specific calculation if it is both:
-
Supported by all the connections in the multi-connection data source
-
Supported by Tableau extracts.
In web authoring (Tableau Online and Tableau Server): You can use a specific calculation if it is supported by all the connections in the multi-connection data source.
Stored procedures
Stored procedures are not available for multi-connection data sources.
Pivot data from within a connection
To pivot data, you must use text columns or Excel columns from the same connection. That is, you cannot include columns from different databases in a pivot.
Make extract files the first connection (Tableau Desktop only)
When connecting to extract files in a multi-connection data source, make sure that the connection to the extract (.tde or .hyper) file is the first connection. This preserves any customizations that might be a part of the extract, including changes to default properties, calculated fields, groups, aliases, etc.
Note: If you need to connect to multiple extract files in your multi-connection data source, only the customizations in the extract in the first connection are preserved.
Extracts of multi-connection data sources that contain connections to file-based data (Tableau Desktop only)
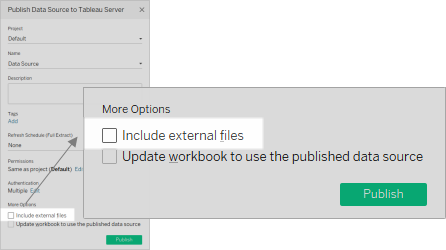
If you're publishing an extract of a multi-connection data source that contains a connection to file-based data such as Excel, selecting the Include external files option puts a copy of the file-based data on the server as part of the data source. In this case, a copy of your file-based data can be downloaded and its contents accessed by other users. If there is sensitive information in the file-based data that you have intentionally excluded from your extract, do not select Include external files when you publish the data source.
For more information about publishing data sources, see Publish a Data Source.
About queries and cross-database joins
For each connection, Tableau sends independent queries to the databases in the join. The results are stored in a temporary table, in the format of an extract file.
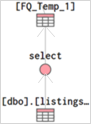
For example, suppose you create connections to two tables, dbo.listings and reviews$. These tables are stored in two different databases, SQL Server and Excel. Tableau queries the database in each connection independently. The database performs the query and applies customizations such as filters and calculations, and Tableau stores the results for each connection in a temporary table. In this example, FQ_Temp_1 is the temporary table for the connection to SQL Server and FQ_Temp_2 is the temporary table for the connection to Excel.
| SQL Server table
|
Excel table 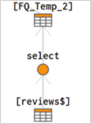 |
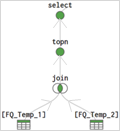
When you perform a cross-database join, the temporary tables are joined together by Tableau Desktop. These temporary tables are necessary for Tableau to perform cross-database joins.
After the tables have been joined, "topn" filter is applied to limit the number of values shown in the data grid to the first 1,000 rows. This filter is applied to help maintain responsiveness of the data grid and the overall performance of the Data Source page.
Joined tables
Review join results in the data grid
After you have created a join on the canvas, review the data grid to make sure the join produces the results that you expect. If the data grid displays data that you don't expect, you might need to modify the join.
Results in the data grid
-
No data: If no data displays in the data grid, you might need to change the join type or a join field used in the join condition. If you suspect a mismatch between fields in the join, use a calculation instead. For more information, see Use calculations to resolve mismatches between fields in a join.
-
Duplicate data: If you see duplicate data, there a few things you can do. Consider changing the aggregation of the measure that use in your analysis, use a calculation, or use data blending instead. For more information about data blending, see Blend Your Data.
-
Missing data: If some data is missing from the data grid, you might need to change the join type or a join field used in the join condition. Again, if you suspect a mismatch between fields in the join, use a calculation instead. For more information, see Use calculations to resolve mismatches between fields in a join.
-
Many null values: If you see many null values that you do not expect, you might need to change the join type from the full outer type to the inner type.
-
All null values for one table: If all values for one table is null, there are no matches between the tables that you are joining. If this is not expected, consider changing the join type.
Use calculations to resolve mismatches between fields in a join
When the fields in a join condition don't match—that is a mismatch between the values in the fields used in a join condition, the data grid can show little or no data at all. A mismatch between fields can occur for several reasons but often caused by the differences in format of the string values or date values in the fields. In many cases, you can resolve mismatches between the fields in your join by using a calculation.
Most functions are available for you to use in a calculation to create and replace a field in the join condition, with the exception of aggregate functions and table calculation functions.
Note:Join calculations are not supported for QuickBooks Online, Marketo, Oracle Eloqua, Anaplan, ServiceNow ITSM, and web data connectors.
String mismatch
A common mismatch scenario when working with string data occurs when one of the fields on one side of the join condition is equivalent to two or more fields on the other side of the join condition. In this case, you can use a calculation to combine the two fields so that its format matches the other field in the join condition.
For example, suppose you want to join two tables that contain the following data:
| Patron | Contact | |||||||||||||||||||||||||||||||||||||||||||||||||||||||||||||||||
|
|
The common fields between the two tables appear to be name. However, in the Patron table the first and last names are in separate columns and in the Contact table the first and last names are in the same column. To join the tables on names, you can use a calculation in the left side of the join condition to merge the first name and last name columns together.
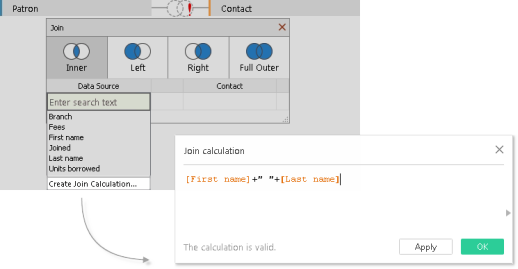
The result is a calculated field on the left side of the join condition that is accessible only from the join dialog. This calculation converts the field in the Patron table into a format that now matches the format of the field in the Contact table on the right side of the join condition.
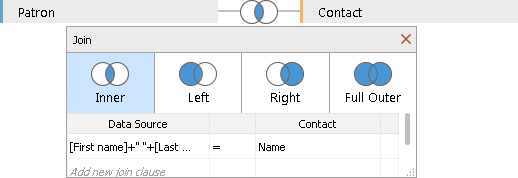
Using the calculation in the join produces the following combined table:
| FIRST NAME | LAST NAME | BRANCH | MEMBER SINCE | UNITS BORROWED | FEES | SUGGESTED LIMIT | NAME | PHONE NUMBER |
|---|---|---|---|---|---|---|---|---|
| Alan | Wang | North | 2000 | 1 | 0 | 15 | Alan Wang | 555-0356 |
| Fred | Suzuki | North | 2000 | 52 | .90 | 15 | Fred Suzuki | 555-0188 |
Date mismatch
A common mismatch scenario when working with date data occurs when the date values in one field of the join condition are captured at a different level of detail than the other field in the join condition. In this case you can use a calculation in the join condition to change the format of the field on one side of the join condition so that its format matches the other field in the join condition.
For example, suppose you have the following two tables of data:
| Projector rental | Patron | ||||||||||||||||||||||||||||||||||||||||||||||||||||||||||||||||||||||||||||||||||||||||||||||||||||||||||||||||||||||||||||||||||
|
|
To find out more information about new patron behavior, joining the Patron table to the Projector Rental table might provide some insight about which library services motivate new memberships. The common fields between the two tables appear to be "Date" and "Member since." However, the date values in each field are captured at different levels of detail. To join these tables on their respective date fields, use a combination of DATE functions in a calculation on each side of the join condition to make the level of detail in each field match.
 |
 |
Using the calculation in the join produces the following combined table:
| DATE | RESERVATION TYPE | REQUESTER ID | ID | FIRST NAME | LAST NAME | BRANCH | MEMBER SINCE | UNITS BORROWED | FEES | SUGGESTED LIMIT |
|---|---|---|---|---|---|---|---|---|---|---|
| 1/1/2000 |
Individual | 233445589 | 232502870 | Alan | Wang | North |
2000 | 1 | 0.00 | 15 |
| 1/1/2000 | Individual | 233445589 | 233445589 | Fred | Suzuki | North | 2000 | 52 | 0.90 | 15 |
| 1/1/2000 | Individual | 233445589 | 233445566 | Ashley | Garcia | South | 2000 | 243 | 11.30 | 15 |
| 1/1/2000 | Individual | 233445589 | 233448978 | Andrew | Smith | North | 2000 | 36 | 3.50 | 15 |
To determine if a patron rented the projector in the same year he or she started his or her membership, add one more clause to the join based on ID.

The result of the additional join condition shows that only one patron might have started his membership to rent a projector.
| DATE | RESERVATION TYPE | REQUESTER ID | ID | FIRST NAME | LAST NAME | BRANCH | JOINED | UNITS BORROWED | FEES | SUGGESTED LIMIT |
|---|---|---|---|---|---|---|---|---|---|---|
| 1/1/2000 | Individual | 233445589 | 233445589 | Fred | Suzuki | North | 2000 | 52 | 0.90 | 15 |
Troubleshoot joins
Over-counting values or duplicated data
When you connect to and join multiple tables together, you set up a denormalized version of the data. In some cases, Tableau treats the multiple tables as one table. When multiple tables are treated as one table, after the tables are joined, all tables are queried. This can cause values to be over-counted.
For example, suppose you have two tables. The first table contains employee information, such as employee ID and salary. The second table contains organizational information, such as department names.
| Table 1
|
Table 2
|
If you join these tables on Employee ID, an employee's salary is counted more than once because the employee is associated with multiple departments.
| Employee ID | Name | Salary | Department | Hire Date | Organization |
| 20107 | Wilson, Henry | 61,000 | Support | 7/28/2015 | Operations |
| 20107 | Wilson, Henry | 61,000 | Sales | 8/25/2016 | Operations |
To help resolve this issue, you can do one of the following:
-
Change the aggregation: Depending on your analysis, you can use the MIN or AVG aggregation to remove over-counting.
For example, if you change the aggregation of Salary from SUM to MIN or from SUM to AVG.
-
Create a calculated field that removes the duplicate values: You can create a calculation that divides the sum of the field being duplicated by the number of instances of the field that is causing the duplication.
For example, the Salary values are being duplicated by the number of instances of Employee ID for Wilson, Henry. In this case, in the view replace Salary with a calculated field that uses the following formula:
SUM ([Salary])/ COUNT ([Employee ID]).You could also use a Level of Detail Expression to delete the duplicate data. For more information, see Removing Duplicate Data with LOD Calculations in the Tableau Knowledge Base.
-
Blend the data: Instead of creating a join, which might duplicate your data, you can blend the data on a common field instead. For more information, see Blend Your Data.
-
Use custom SQL: Tableau supports using custom SQL for connecting to multiple tables in a data source. You can pre-aggregate the tables before joining them with a GROUP BY clause. This option requires some knowledge about writing SQL queries and assistance from a database expert if possible. For more information about how to connect to a custom SQL query from Tableau, see Connect to a Custom SQL Query.
Broken cross-database joins
Before you join tables using a cross-database join, make sure that the data types of the join keys match. If the data types of the join keys don't match, the join breaks, which is indicated by a red exclamation point. To fix a broken join, use one of the following suggestions:
-
You can change the format of a field (including its data type) in the join dialog to make the join keys match by creating a join calculation. A join calculation supports a subset of calculations that lets you modify the format of the join key in one or more tables that you want to combine. To create a join calculation, click the join relationship between the tables that have a broken join, click the field whose format needs to be modified, and then select Create Join Calculation. For more information, see Use calculations to resolve mismatches between fields in a join.
-
For text or Excel-based data, modify the data type of one of the text or Excel fields in the join key using the data type menu in the data grid.
-
Tableau Desktop only: For most connections, you can use the Convert to custom SQL option to change the data type of one of the fields in the join key, using a function like CAST (). The Convert to custom SQL option is available only when the data source contains only one connection. In this case, remove the second connection and then select Data > Convert to custom SQL.