要实现flume的监控首先要了解flume的运行原理
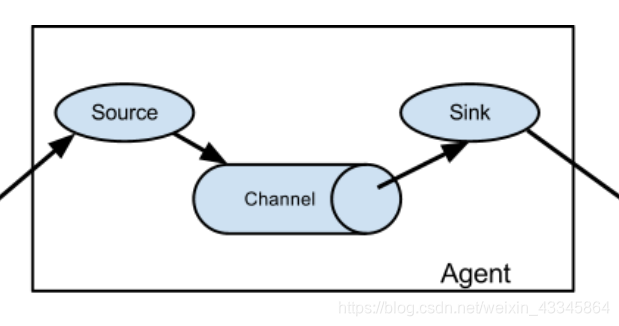
如上图它有一个管道channel前面的source就是要监控的文件或端口,而sink 则是监控到的数据传输的位置。
而且flume的传输单位是一Event为单位,以事件形式将数据从源头传送到目标位置。
下面来说一下具体实现方法
解压然后修改配置文件
修改flume-env.sh里的Java路径
export JAVA_HOME = /home/hadoop/install/jdk1.8.0_152
安装 监控端口工具
yum install telnet
创建监控的配置文件flume-telnet.conf添加
# Name the components on this agent
a1.sources = r1
a1.sinks = k1
a1.channels = c1

# Describe/configure the source
a1.sources.r1.type = netcat
a1.sources.r1.bind = localhost
a1.sources.r1.port = 44444
# Describe the sink
a1.sinks.k1.type = logger

# Use a channel which buffers events in memory
a1.channels.c1.type = memory
a1.channels.c1.capacity = 1000
a1.channels.c1.transactionCapacity = 100

# Bind the source and sink to the channel
a1.sources.r1.channels = c1
a1.sinks.k1.channel = c1
判断端口是否被占用
netstat -tunlp | grep 44444
在flume安装路径下监控输出端口
bin/flume-ng a1--conf conf/ --name a1 --conf-file conf/flume-telnet.conf -Dflume.root.logger==INFO,console
再开一个终端控制台执行
telnet localhost 44444
在此控制台输入一些字符,点回车提交输入,看监控的控制台是否有相同字符打印。
如果输入内容错误,可以按住Ctrl键同时点删除。
监控文件
创建配置文件在flume-file.conf添加
a1.sources = s1
a1.channels = c1
a1.sinks = k1

a1.sources.s1.type=exec
a1.sources.s1.command=tail -F /tmp/logs/kafka.log
a1.sources.s1.channels=c1
a1.channels.c1.type=memory
a1.channels.c1.capacity=10000
a1.channels.c1.transactionCapacity=100
# Describe the sink
a1.sinks.k1.type = logger
# Use a channel which buffers events in memory
a1.channels.c1.type = memory
a1.channels.c1.capacity = 1000
a1.channels.c1.transactionCapacity = 100

# Bind the source and sink to the channel
a1.sources.s1.channels = c1
a1.sinks.k1.channel = c1
在flume安装路径下监控输出端口
bin/flume-ng agent --conf conf/ --name a1 --conf-file conf/flume-file.conf -Dflume.root.logger==INFO,console
再开一个终端多次输入类似下面的语句
echo "aaa" >> /tmp/logs/kafka.log
看监控输出端口的控制台变化。
注意:
监控端口格式是netcat,监控文件是exec,监控文件夹的格式是spooldir
flume的source 与sink对接格式为avro