机器学习训练营——机器学习爱好者的自由交流空间(qq 群号:696721295)
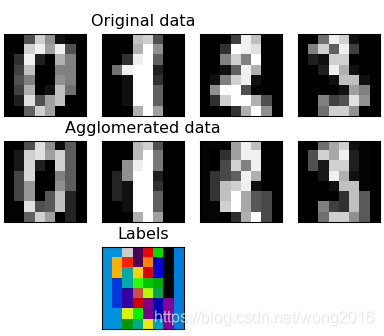
本例演示如何使用特征集聚(feature agglomeration)将相似的特征合并到一起。所谓“特征集聚”,是指迭代地将相似的特征合并到一起,类似于聚类,但这里聚的是特征而不是样本。本例使用的数据集是手写数字识别数据集。
实例详解
首先,导入必需的库。
import numpy as np
import matplotlib.pyplot as plt

from sklearn import datasets, cluster
from sklearn.feature_extraction.image import grid_to_graph
导入手写数字数据集digits, 它是一个三维数组(1797, 8, 8). 即,有1797个手写数字,每个数字由8*8的像素矩阵组成。在这里,我们使用numpy库的reshape函数将它变成(1797, 64)的二维数组。
digits = datasets.load_digits()
images = digits.images
X = np.reshape(images, (len(images), -1))
connectivity = grid_to_graph(*images[0].shape)
使用cluster模块的FeatureAgglomeration方法进行特征集聚。在这里,指定聚类数为32,每个特征的邻居特征的连接形式由参数connectivity指定,它是一个矩阵。然后,在reshape的数组X上拟合、变换。
agglo = cluster.FeatureAgglomeration(connectivity=connectivity,
                                     n_clusters=32)

agglo.fit(X)
X_reduced = agglo.transform(X)

X_restored = agglo.inverse_transform(X_reduced)
images_restored = np.reshape(X_restored, images.shape)
最后,可视化特征集聚后的手写数字图像。
plt.figure(1, figsize=(4, 3.5))
plt.clf()
plt.subplots_adjust(left=.01, right=.99, bottom=.01, top=.91)
for i in range(4):
    plt.subplot(3, 4, i + 1)
    plt.imshow(images[i], cmap=plt.cm.gray, vmax=16, interpolation='nearest')
    plt.xticks(())
    plt.yticks(())
    if i == 1:
        plt.title('Original data')
    plt.subplot(3, 4, 4 + i + 1)
    plt.imshow(images_restored[i], cmap=plt.cm.gray, vmax=16,
               interpolation='nearest')
    if i == 1:
        plt.title('Agglomerated data')
    plt.xticks(())
    plt.yticks(())

plt.subplot(3, 4, 10)
plt.imshow(np.reshape(agglo.labels_, images[0].shape),
           interpolation='nearest', cmap=plt.cm.nipy_spectral)
plt.xticks(())
plt.yticks(())
plt.title('Labels')
plt.show()
阅读更多精彩内容,请关注微信公众号:统计学习与大数据