版权声明:本文为博主原创文章,未经博主允许不得转载。 https://blog.csdn.net/qwqw3333333/article/details/83213696
文章目录
1 Hystrix Dashboard案例
SpringCloud对Hystrix Dashboard进行了整合,可以对通过Hystrix发起的请求进行准实时统计,并以报表和图形的形式展示给用户(包括每秒执行多少次?请求成功和失败等)。新建一个consumer hystrix dashboard服务,在consumer hystrix基础上改进:
1.1 增加依赖
<dependency>
    <groupId>org.springframework.cloud</groupId>
    <artifactId>spring-cloud-starter-hystrix</artifactId>
</dependency>
<dependency>
    <groupId>org.springframework.cloud</groupId>
    <artifactId>spring-cloud-starter-hystrix-dashboard</artifactId>
</dependency>
<dependency>
    <groupId>org.springframework.boot</groupId>
    <artifactId>spring-boot-starter-actuator</artifactId>
</dependency>
1.2 编写启动类
@SpringBootApplication
@EnableEurekaClient
@EnableFeignClients
@EnableHystrixDashboard
@EnableCircuitBreaker
public class SpringCloudConsumerHystrixDashboardApplication80 {
    public static void main(String[] args) {
        SpringApplication.run(SpringCloudConsumerHystrixDashboardApplication80.class, args);
    }
}
1.3 测试
启动服务,访问地址:http://localhost/hystrix,看到豪猪界面表示已经配置好了。
从页面的文字内容中我们可以知道,Hystrix Dashboard共支持三种不同的监控方式,依次为:
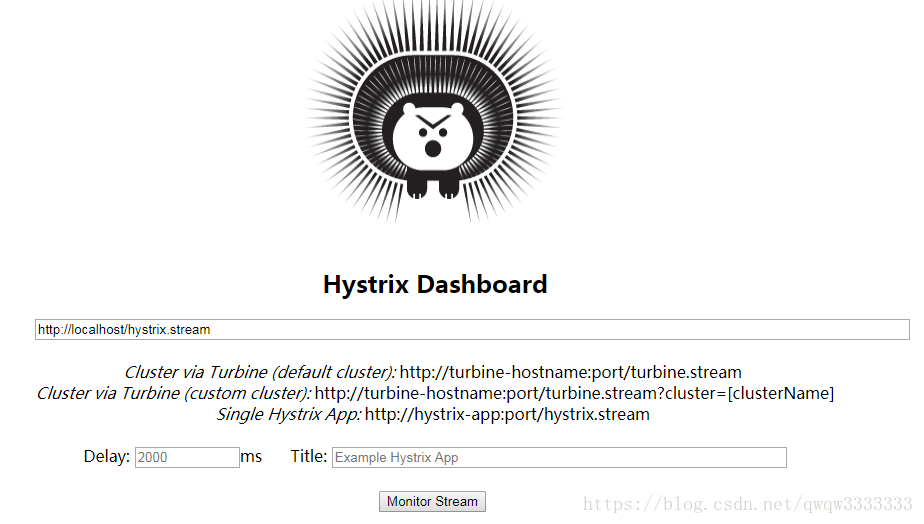
- 默认的集群监控:通过URLhttp://turbine-hostname:port/turbine.stream开启,实现对默认集群的监控。
- 指定的集群监控:通过URLhttp://turbine-hostname:port/turbine.stream?cluster=[clusterName]开启,实现对clusterName集群的监控。
- 单体应用的监控:通过URLhttp://hystrix-app:port/hystrix.stream开启,实现对具体某个服务实例的监控。
1.4 监控
在网址输入框输入http://localhost/hystrix.stream ,然后点击 Monitor Stream,进入页面:
如何看图
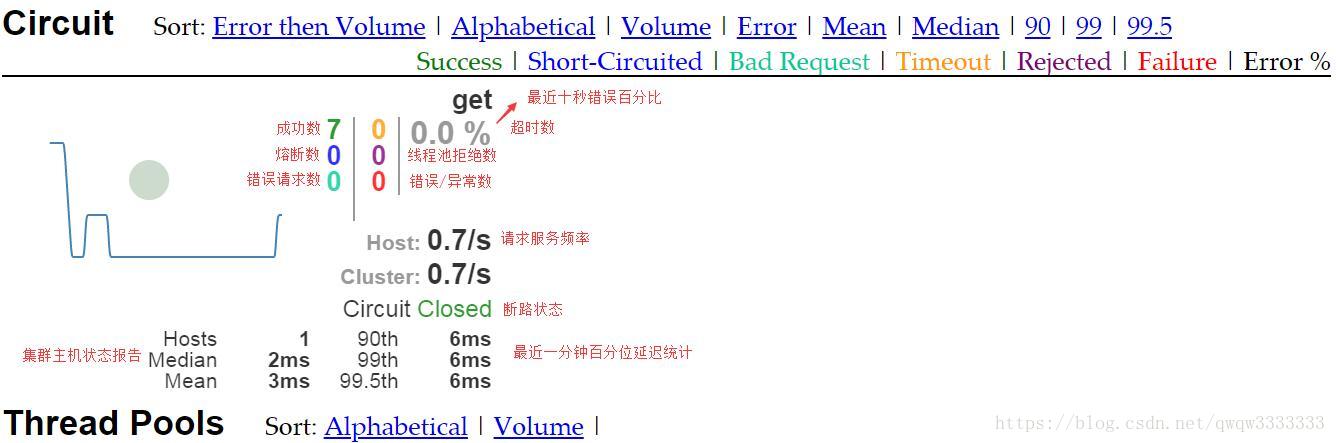
- 七色:进入监控界面后会有其中颜色的数字,其含义可以对应右上角相同颜色的单词表示的状态,其值代表该状态下触发的次数。
- 一圈:圈的颜色变化代表了实例的健康程度,它的健康度从绿色、黄色、橙色、红色递减。圈的大小代表该服务的流量,圈越大流量越大。
- 一线:代表监控间隔中,服务被访问的频率的折线图。
- 通过观察这些就可以在大量的实例中找出故障实例和高压实例进行修复和维护。
2 Hystrix Dashboard Turbine案例
Hystrix Dashboard 只能实现对服务单个实例的数据展现,分布式系统中,为了实现高可用,相同的服务肯定会布置很多甚至成百上千个,我们希望这些对服务数据进行聚合展示分析。 为此,Netflix提供了一个开源项目(Turbine),它将帮助我们实现该功能。
2.1 创建Hystrix Dashboard Turbine服务
2.1.1 添加依赖。
<dependencies>
    <dependency>
        <groupId>org.springframework.cloud</groupId>
        <artifactId>spring-cloud-starter-hystrix-dashboard</artifactId>
    </dependency>
    <dependency>
        <groupId>org.springframework.cloud</groupId>
        <artifactId>spring-cloud-netflix-turbine</artifactId>
    </dependency>
    <dependency>
        <groupId>org.springframework.cloud</groupId>
        <artifactId>spring-cloud-starter-turbine</artifactId>
    </dependency>
    <dependency>
        <groupId>org.springframework.boot</groupId>
        <artifactId>spring-boot-starter-actuator</artifactId>
    </dependency>
</dependencies>
2.1.2 编写配置文件。
server:
  port: 9001
spring:
  application:
    name: spring-cloud-hystrix-dashboard-turbine
eureka:
  client:
    service-url:
      defaultZone: http://eureka7002.com:7002/eureka/,http://eureka7001.com:7001/eureka/
turbine:
  app-config: spring-cloud-consumer-hystrix-dashboard-turbine-node-9002,spring-cloud-consumer-hystrix-dashboard-turbine-node-9003
  clusterNameExpression: new String("default")
  aggregator:
    clusterConfig: default
- turbine.appConfig :配置需要聚合的应用。
- turbine.aggregator.clusterConfig :指定聚合哪些集群,多个使用”,”分割,默认为default。可使用http://…/turbine.stream?cluster={clusterConfig之一}访问
- turbine.clusterNameExpression :
- clusterNameExpression指定集群名称,默认表达式appName;此时,turbine.aggregator.clusterConfig需要配置想要监控的应用名称;
- 当clusterNameExpression: default时,turbine.aggregator.clusterConfig可以不写,因为默认就是default;
- 当clusterNameExpression: metadata[‘cluster’]时,假设想要监控的应用配置了eureka.instance.metadata-map.cluster: A,则需要同时配置turbine.aggregator.clusterConfig: A
2.1.3 启动类添加@EnableTurbine,激活对Turbine的支持。
@SpringBootApplication
@EnableHystrixDashboard
@EnableTurbine
public class SpringCloudHystrixDashboardTurbineApplication9001 {
	public static void main(String[] args) {
		SpringApplication.run(SpringCloudHystrixDashboardTurbineApplication9001.class, args);
	}
}
2.2 在项目spring-cloud-consumer-hystrix-80基础上改造两个服务消费者
2.2.1 改造spring-cloud-consumer-hystrix-dashboard-turbine-node-9002
2.2.1.1 改动application.yml
server:
  port: 9002
spring:
  application:
    name: spring-cloud-consumer-hystrix-dashboard-turbine-node-9002
eureka:
  client:
    service-url:
      defaultZone: http://eureka7001.com:7001/eureka/,http://eureka7002.com:7002/eureka/,http://eureka7003.com:7003/eureka/
feign:
  hystrix:
    enabled: true
2.2.2 改造spring-cloud-consumer-hystrix-dashboard-turbine-node-9003
2.2.2.1 改动application.yml
server:
  port: 9003
spring:
  application:
    name: spring-cloud-consumer-hystrix-dashboard-turbine-node-9003
eureka:
  client:
    service-url:
      defaultZone: http://eureka7001.com:7001/eureka/,http://eureka7002.com:7002/eureka/,http://eureka7003.com:7003/eureka/
feign:
  hystrix:
    enabled: true
2.2.2.2 改动HelloRemote接口
@FeignClient(name= "spring-cloud-provider", fallback = HelloRemoteFallback.class)
public interface HelloRemote {
    @RequestMapping(value = "/hello/{name}")
     String hello2(@RequestParam(value = "name") String name);
}
2.2.2.3 改动对应的类(看源码)
2.3 测试
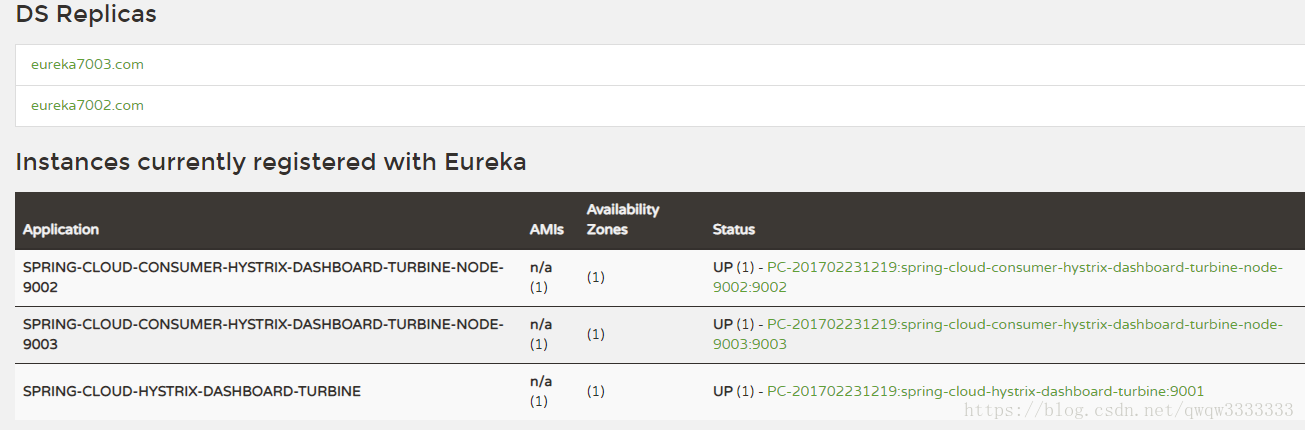
依次启动uereka、spring-cloud-consumer-hystrix-dashboard-turbine-node-9002、spring-cloud-consumer-hystrix-dashboard-turbine-node-9003、spring-cloud-hystrix-dashboard-turbine-9001
- 访问eureka,http://eureka7001.com:7001/,可以看到注册三个微服务。
- 依次访问http://localhost:9002/consumer/hello/jack,http://localhost:9003/consumer/hello/jack。
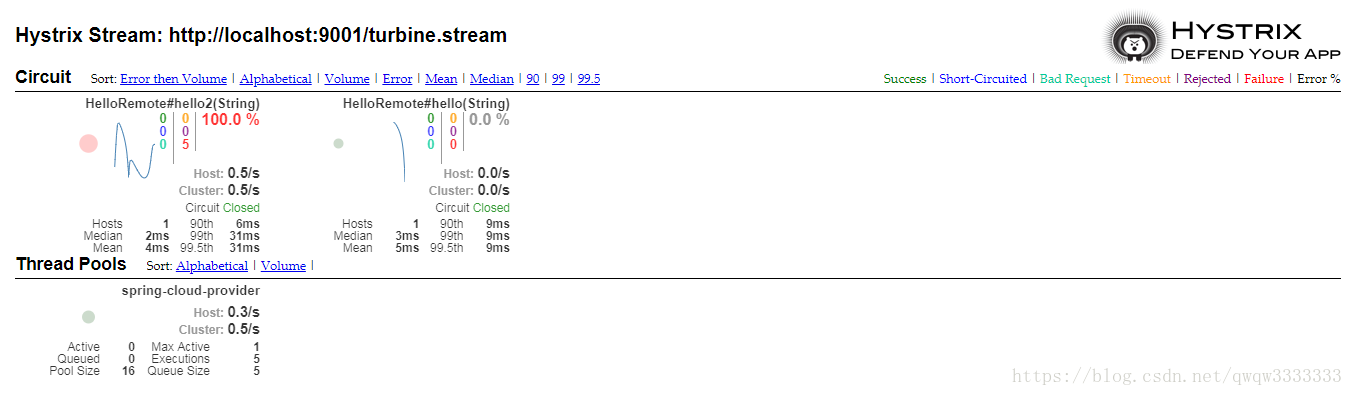
- 访问http://localhost:9001/hystrix。
- 监控地址填入http://localhost:9001/turbine.stream。