1. Hystrix Dashboard (断路器:hystrix 仪表盘)
Hystrix一个很重要的功能是,可以通过HystrixCommand收集相关数据指标. Hystrix Dashboard可以很高效的现实每个断路器的健康状况。
1). 在Ribbon服务g和Feign服务的Maven工程的pom.xml中都加入依赖

1 <dependency>
2     <groupId>org.springframework.boot</groupId>
3     <artifactId>spring-boot-starter-actuator</artifactId>
4  </dependency>
5 <dependency>
6     <groupId>org.springframework.cloud</groupId>
7     <artifactId>spring-cloud-starter-hystrix-dashboard</artifactId>
8 </dependency>
spring-boot-starter-actuator用于手机metric, 支持hystrix.stream。spring-cloud-starter-hystrix-dashboard支持dashboard的UI
2)在Spring Boot启动类上用@EnableHystrixDashboard注解和@EnableCircuitBreaker注解。需要特别注意的是我们之前的Feign服务由于内置断路器支持, 所以没有@EnableCircuitBreaker注解,但要使用Dashboard则必须加,如果不加,Dashboard无法接收到来自Feign内部断路器的监控数据,会报“Unable to connect to Command Metric Stream”错误
 1 @SpringBootApplication
 2 @EnableDiscoveryClient
 3 @EnableFeignClients
 4 @EnableCircuitBreaker
 5 @EnableHystrixDashboard
 6 public class ServiceFeignApplication {
 7
 8     public static void main(String[] args) {
 9         SpringApplication.run(ServiceFeignApplication.class, args);
10     }
11 }
3)然后就可以访问/hystrix,这个URL将dashboard指向定义在Hystrix客户端应用中的/hystrix.stream
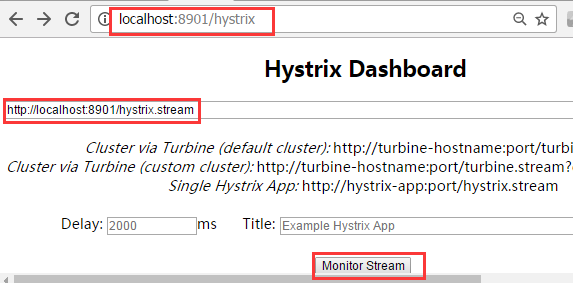
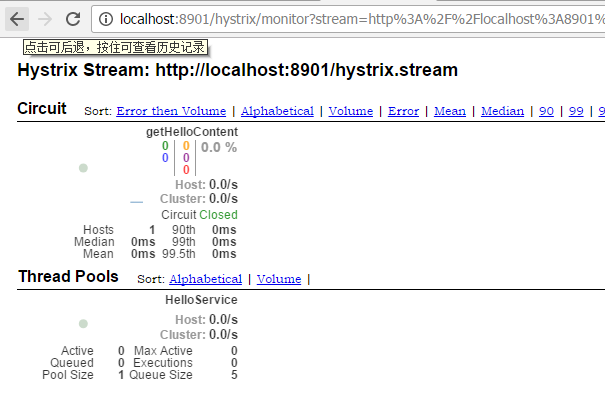
在dashboard中输入服务的URL:点击 monitor后进入监控界面,访问我们之前创建的Ribbon服务localhost:8901/, 或者Feign服务localhost:8902/可以看到监控UI动态变化
2. 利用Turbine在一个Dashboard上监控多个流
以上例子只能监控一个,要同时监控多个流怎么办? 答案是, 可以单独做一个Turbine服务,专门监控所有断路器状态,从而掌握整个系统中所有微服务的状态。下面我们就来创建一个Turbine服务,来监控我们之前做的Feign服务和Ribbon服务
1). 创建一个maven工程, 在pox.xml添加以下依赖
 1         <dependency>
 2             <groupId>org.springframework.cloud</groupId>
 3             <artifactId>spring-cloud-starter-turbine</artifactId>
 4         </dependency>
 5         <dependency>
 6             <groupId>org.springframework.cloud</groupId>
 7             <artifactId>spring-cloud-netflix-turbine</artifactId>
 8         </dependency>
 9         <dependency>
10             <groupId>org.springframework.boot</groupId>
11             <artifactId>spring-boot-starter-actuator</artifactId>
12         </dependency>
13         <dependency>
14             <groupId>org.springframework.cloud</groupId>
15             <artifactId>spring-cloud-starter-hystrix-dashboard</artifactId>
16         </dependency>
整个个pox.xml文件如下:
 pom.xml
2). 创建Turbine Dashboard启动类:
用@EnableHystrixDashboard和@EnableTurbine修饰主类, 分别用于支持Hystrix Dashboard和Turbine
 1 package spring.helloworld.turbine.service;
 2
 3 import org.springframework.boot.SpringApplication;
 4 import org.springframework.boot.autoconfigure.SpringBootApplication;
 5 import org.springframework.cloud.netflix.hystrix.dashboard.EnableHystrixDashboard;
 6 import org.springframework.cloud.netflix.turbine.EnableTurbine;
 7
 8 @SpringBootApplication
 9 @EnableHystrixDashboard
10 @EnableTurbine
11 public class DashboardApplication {
12
13     public static void main(String[] args) {
14         SpringApplication.run(DashboardApplication.class, args);
15     }
16 }
3). 在application.yml中配置turbine参数
 1 eureka:
 2     client:
 3         serviceUrl:
 4             defaultZone: http://localhost:8761/eureka/
 5 server:
 6     port: 8903
 7 spring:
 8     application:
 9         name: hystrix-dashboard-turbine
10 turbine:
11     appConfig: service-feign, service-ribbon
12     aggregator:
13         clusterConfig: default
14     clusterNameExpression: new String("default")
turbine.appConfig定义了要监控的服务,这里是我们在前面章节创建的service-feign和sercice-ribbon; aggregator.clusterConfig定义了聚合方式, 此处为default.
turbine.appConfig :配置Eureka中的serviceId列表,表明监控哪些服务
turbine.aggregator.clusterConfig :指定聚合哪些集群,多个使用”,”分割,默认为default。可使用http://.../turbine.stream?cluster={clusterConfig之一}访问
turbine.clusterNameExpression :指定集群名称,可以是三种类型的值
- 默认表达式为appName;此时turbine.aggregator.clusterConfig需要配置想要监控的应用名称;
- 当为default时,turbine.aggregator.clusterConfig可以不写,因为默认就是default;
- 当为metadata[‘cluster’]时,假设想要监控的应用配置了eureka.instance.metadata-map.cluster: ABC,则需要配置,同时turbine.aggregator.clusterConfig: ABC
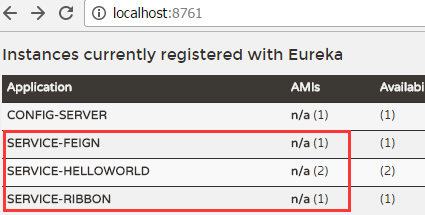
4). 依次启动eureka服务, 2个Helloworld服务, Feign服务,ribbon服务和刚创建turbine服务。从eureka服务中我们可以看到
5)通过Turbine服务访问HystrixDashborad, http:localhost:8903/hystrix
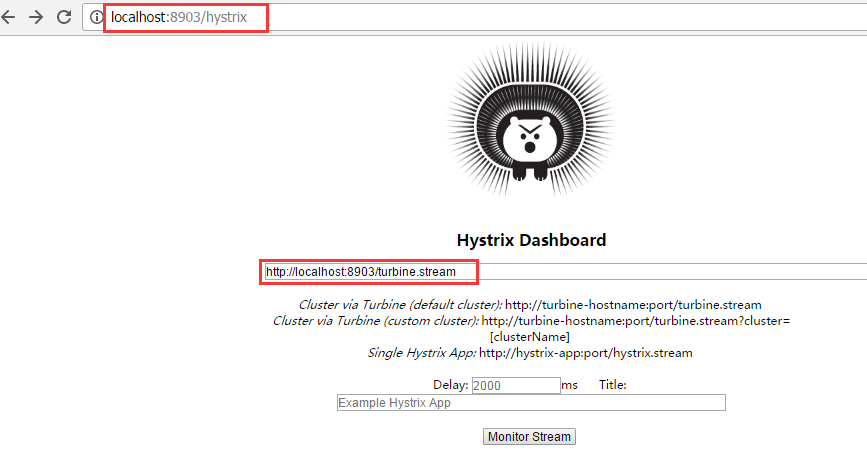
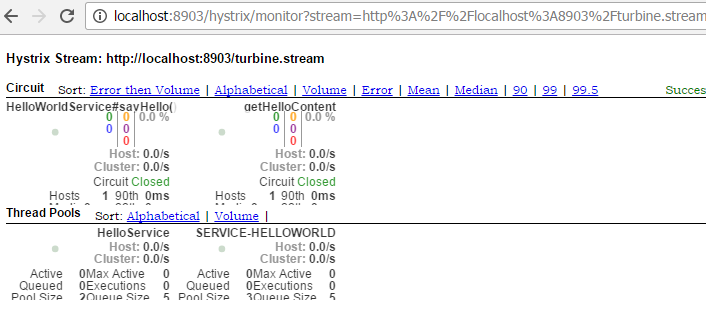
监控流的URL填http://localhost:8903/turbine.stream, 点击monitor stream, 进入监控页面, 随便刷新下feign和ribbon服务(http://localhost:8902/hello和http://localhost:8901), 可以看到监控页面的变化。如下图, 两个服务的监控都会显示在dashboard上