相关文章:
Spring cloud - 概述
Spring cloud eureka - 注册中心
Spring cloud feign - RPC
Spring cloud ribbon - 负载均衡
Spring cloud hystrix - 断路器
Spring cloud hystrix dashboard - 断路器dashboard
Spring cloud zuul- 网关
关键字
断路器UI
背景
上一节我们讲到了断路器(Hystrix ),Hystrix 可以在系统不稳定时及时断开外部请求,防止雪崩,以达到保护系统的整体稳定性。但是由于这些操作都由Hystrix 自动完成,开发人员无法获知到底哪些服务有问题,以及相应请求的成功率、响应时间等信息以备后续分析和改进。
如果有一款工具可以让我们能直观的看到各服务的实时健康信息,就可以轻松的分析每个服务的调用情况,并能及时分析和解决对应的系统问题。
幸运的是netflix已经帮我们提供了一款基于Hystrix 的实时监控工具 - hystrix-dashbaord,它可以实时收集来自HystrixCommand的度量信息.Hystrix Dashboard把每一个断路器的健康状态以一种高效的方式展示出来。
什么是hystrix dashboard
hystrix dashboard是一款由netfilx提供的,基于hystrix Commond,并将hystrix commond收集到的服务健康信息以图形化展示的界面工具。效果如下:
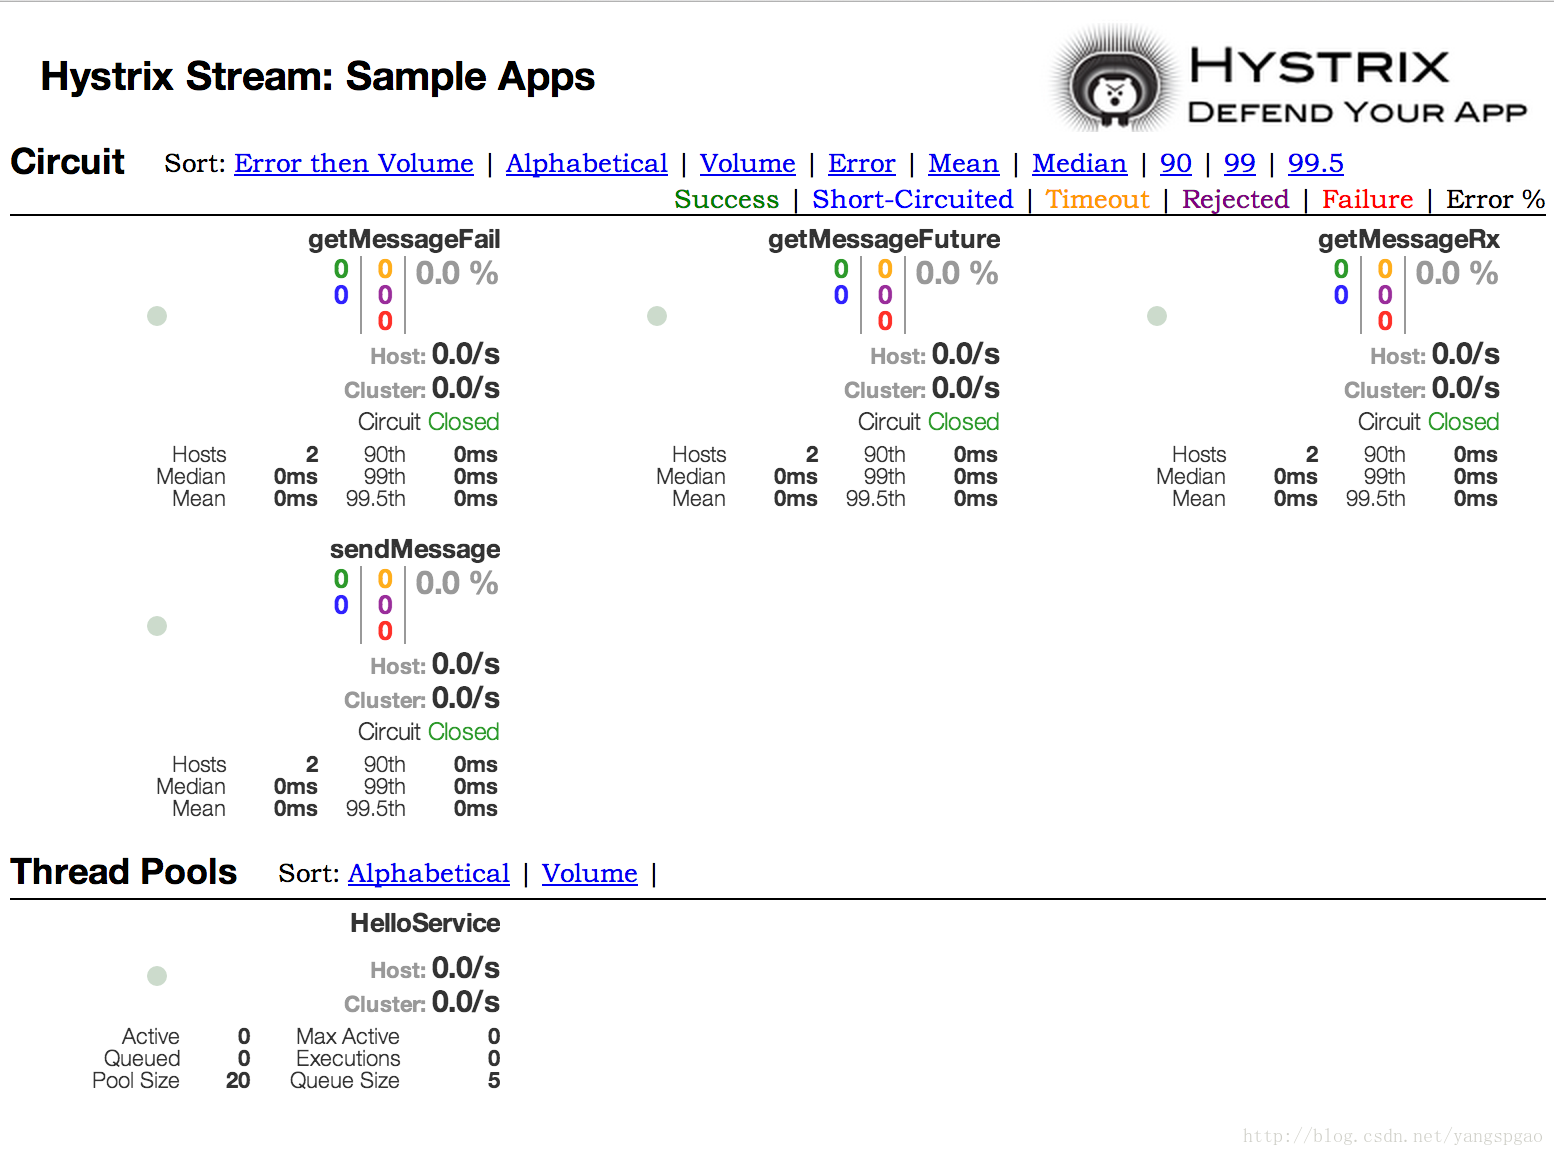
上图中每一块就代表一个接口的调用指标,具体解释如下:
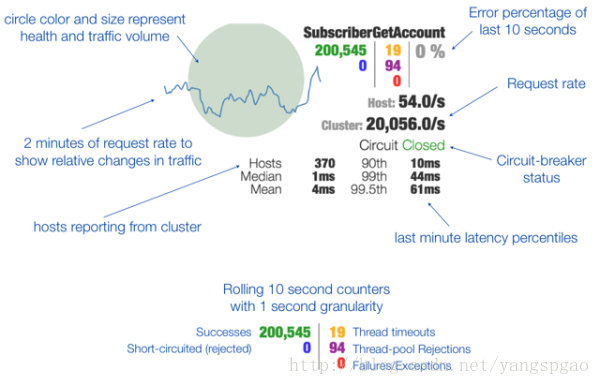
- 圆形颜色和大小:代表健康情况和流量
- 折线:2分钟内的吞吐率变化情况
- hosts:集群中节点个数
- median: 每个请求时间的中位数
- mean: 平均每个请求消耗的时间
- subscriberGetAccount:
绿200545:代表成功请求数量
蓝0:代表断路数量
黄19:代表表超时的线程数量
紫94:代表线程池拒绝次数,即线程不够用
红0: 失败或异常数量
灰0%: 最后10秒错误率 - host: 各节点每秒的平均请求吞吐量
- cluster: 集群每秒的请求吞吐量
- circuit:代表断路器状态即:是否打开断路器 90th,99th,99.5th:
最后1分钟各种延迟的百分比。如图:90%的请求小于10ms;而99%的请求小于44ms,99.5%的请求在61ms完成。
集成
创建项目
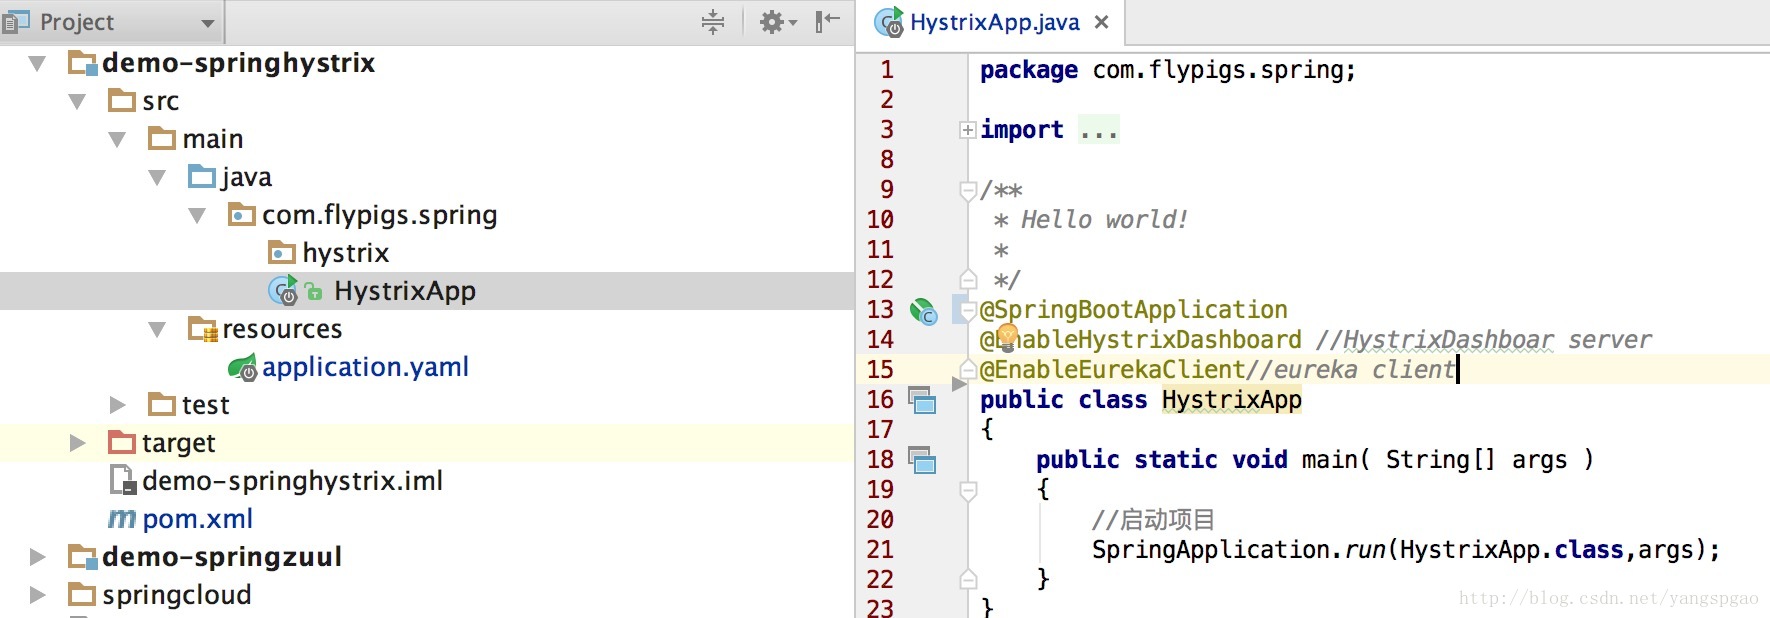
创建一个名为demo-springhystrix的项目如下:
依赖
集成dashboard,需要加入下以依赖(starter).
    <dependency>
      <groupId>org.springframework.cloud</groupId>
      <artifactId>spring-cloud-starter-hystrix-dashboard</artifactId>
    </dependency>
      <!--actuator 用于打开默认的endpoints-->
    <dependency>
      <groupId>org.springframework.boot</groupId>
      <artifactId>spring-boot-starter-actuator</artifactId>
    </dependency>
代码
  @SpringBootApplication
  @EnableHystrixDashboard //启动HystrixDashboard server
  public class HystrixApp
  {
      public static void main( String[] args )
      {
          //启动项目
          SpringApplication.run(HystrixApp.class,args);
      }
  }
配置
配置application.yml

#端口
server:
  port: 9292
测试
先启动eureka(注册中心)、测试用的微服务
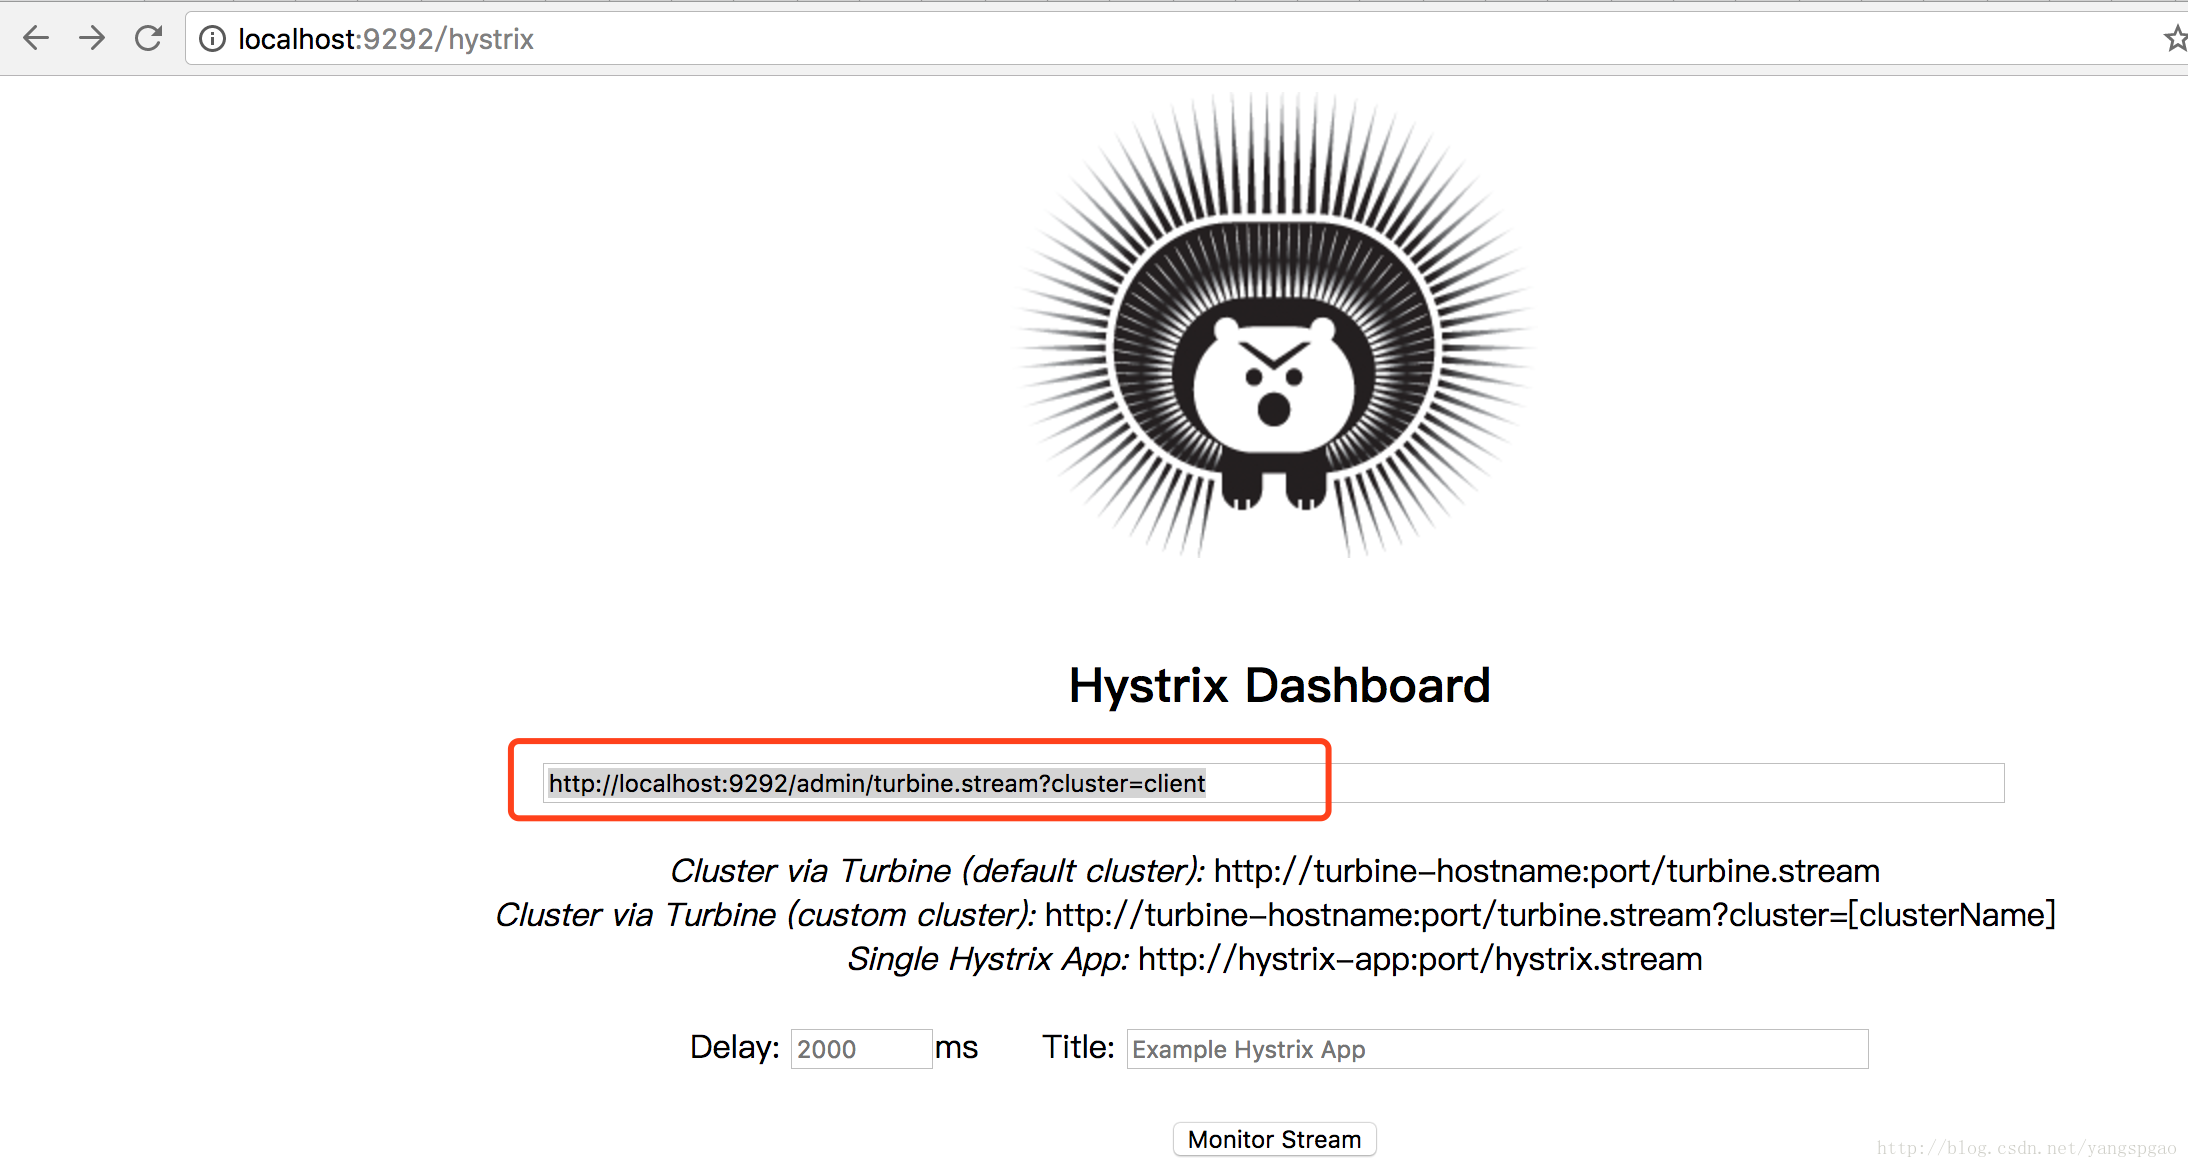
启动成功后访问http://dashboard-hostName:port/hystrix
如:http://localhost:9292/hystrix
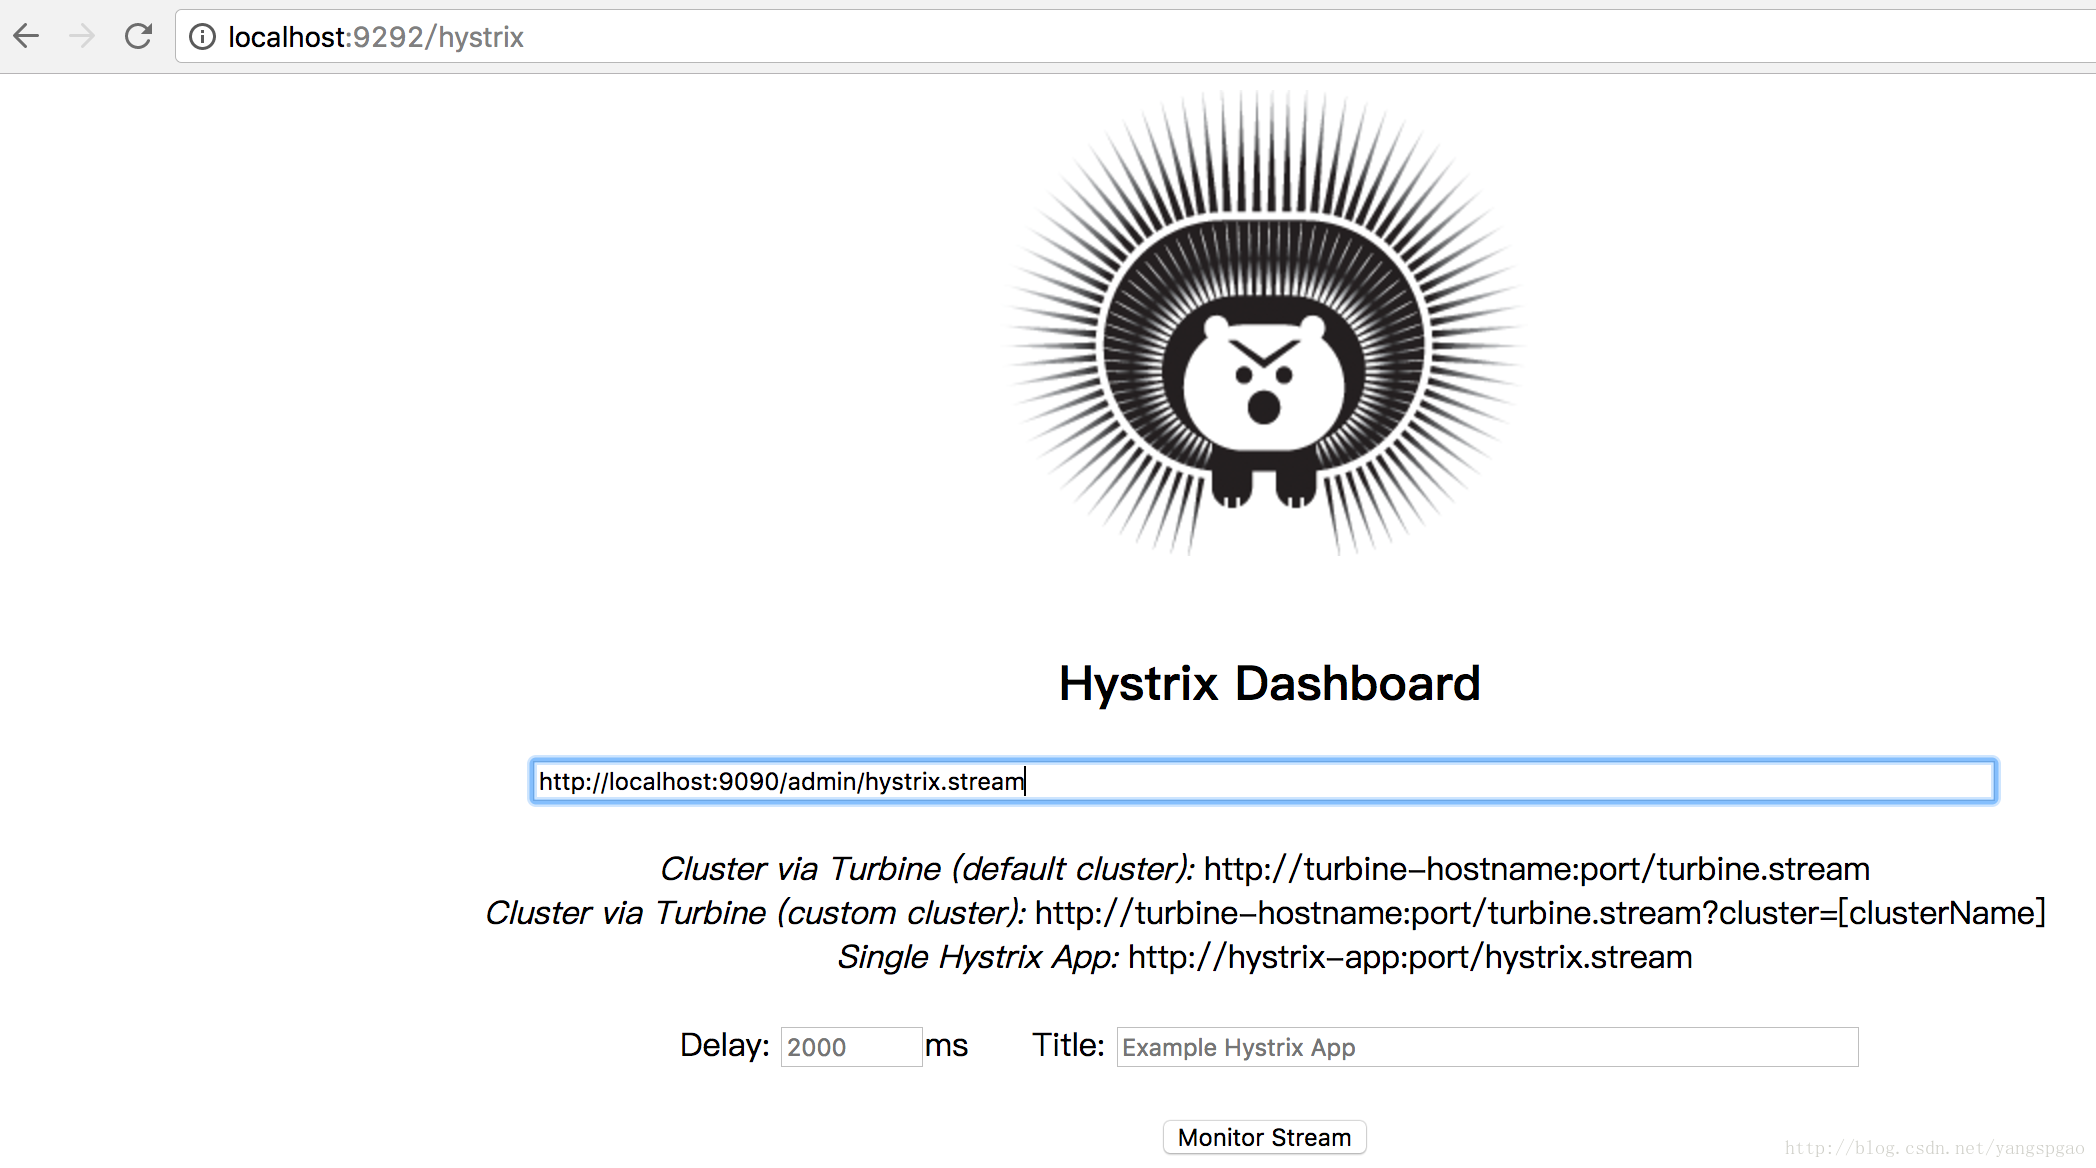
在上面界面中输入微服务某个具体节点地址:http://localhost:9090/admin/hystrix.stream
由于9090对应的服务配置了context-path,因此上面/hystrix.stream前增了加/admin
#9090的微服务配置了context-path,
management:
  context-path: /admin
  port: ${server.port}
点击:monitor stream 如下,如果没有数据,可先调用微服务接口,如:http://local.dooioo.net:9090/v2/hello?name=abc,然后再刷新dashboard
原理
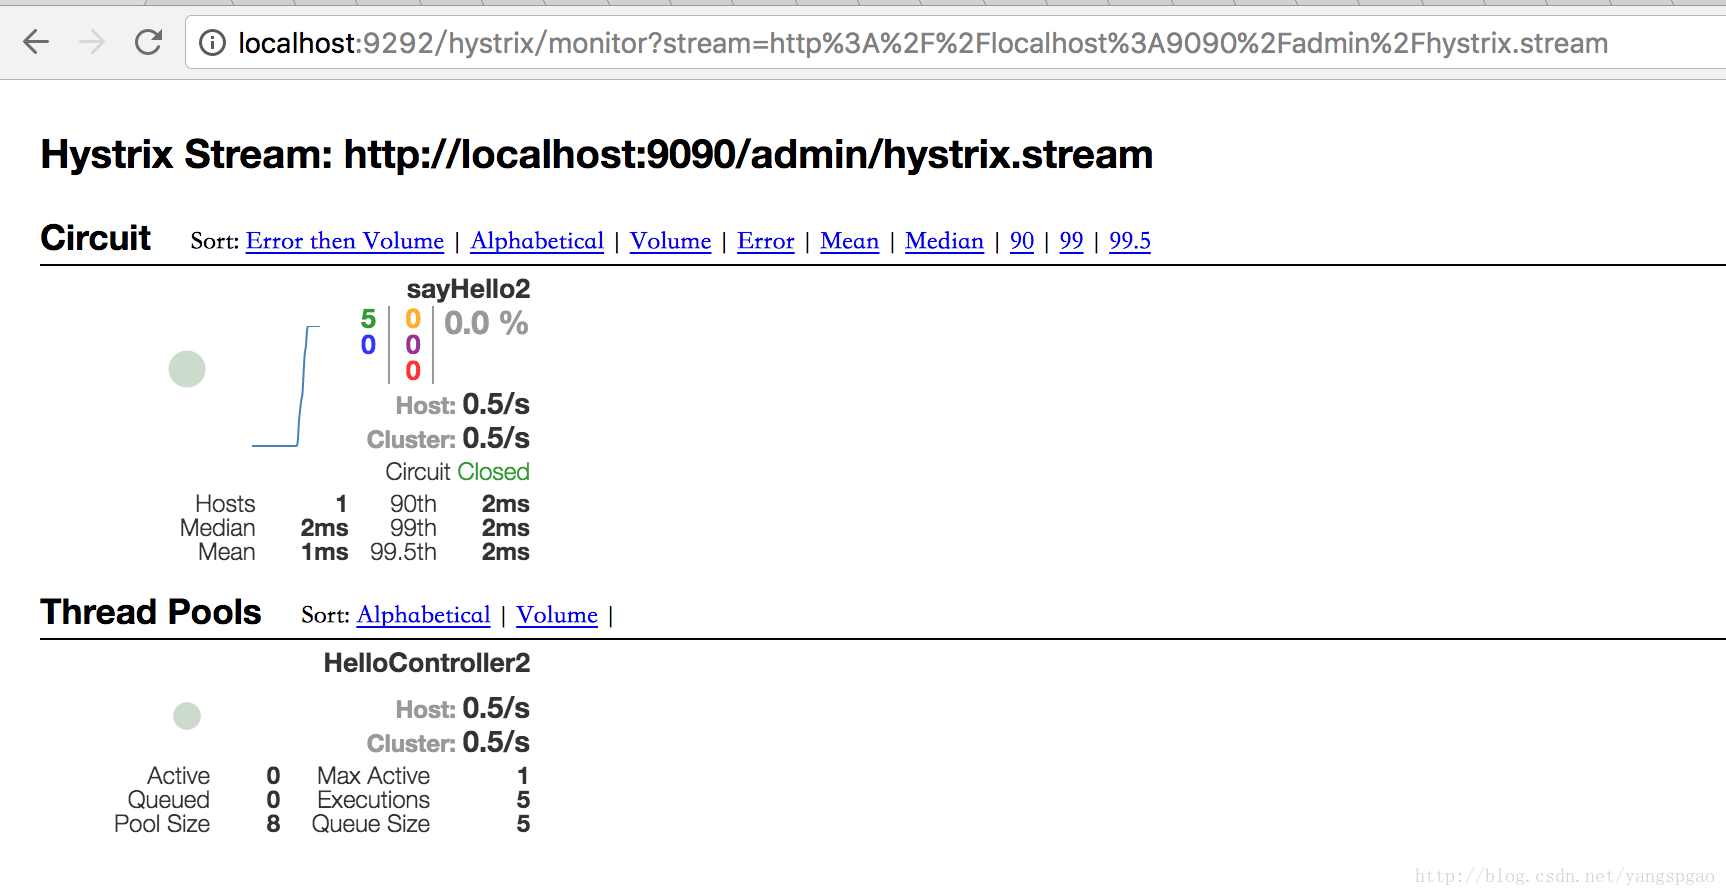
A: 通过dashboard页面查询聚合信息
http://localhost:9292/monitor/hystrix?stream=http://localhost:9090/admin/hystrix.stream
访问hystrix dashboard的/monitor/hystrix页面,并以http://localhost:9090/admin/hystrix.stream(具体节点的hystrix数据地址)做为stream参数。
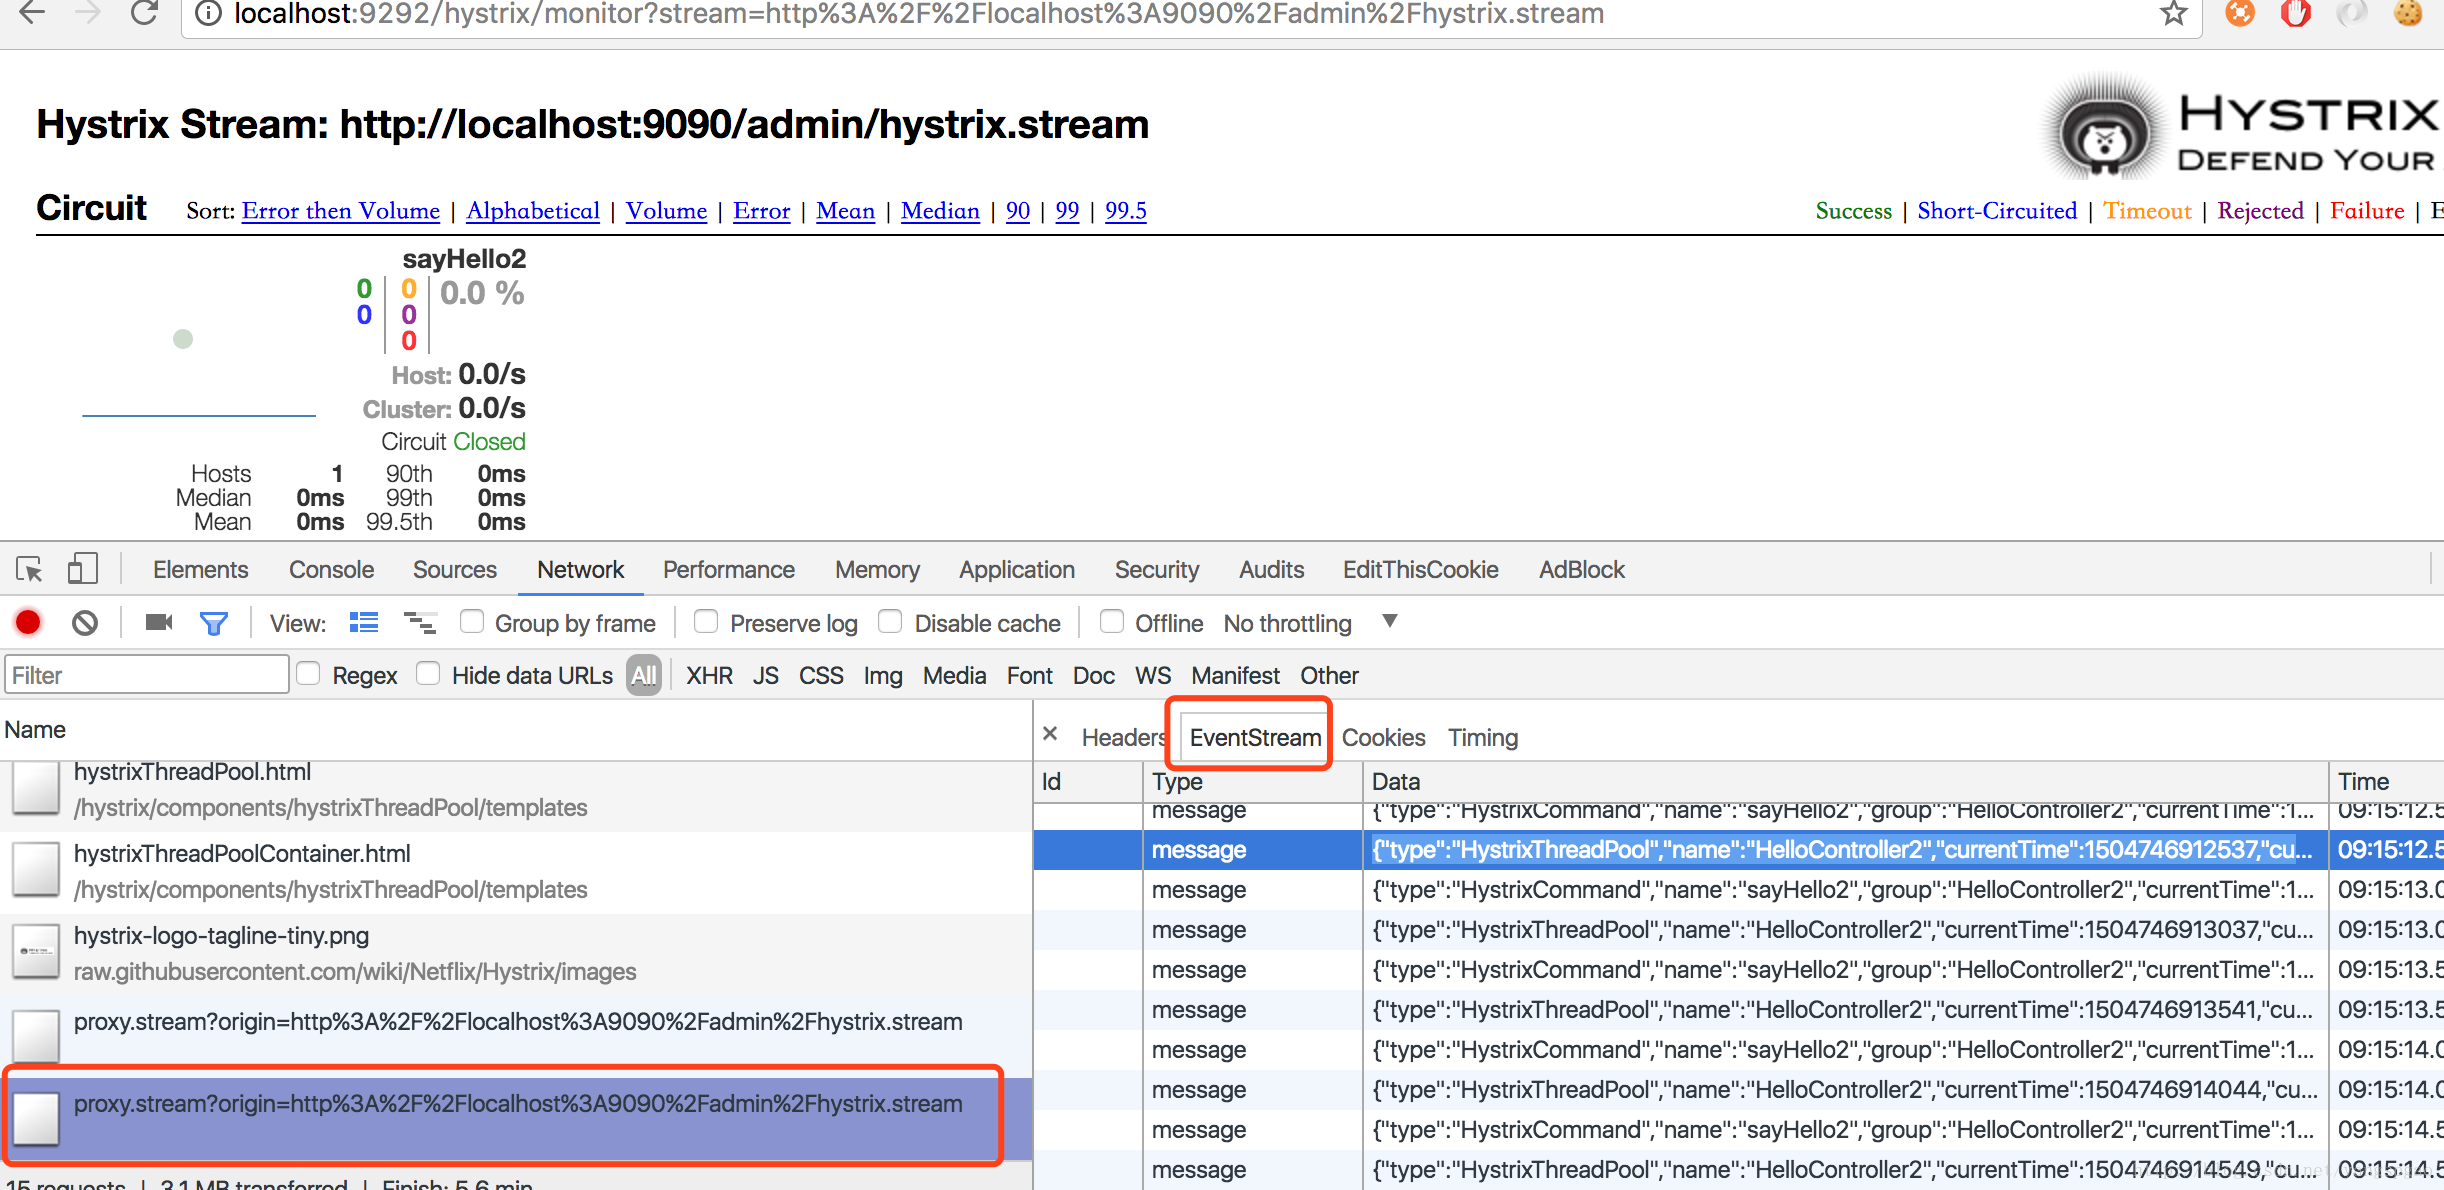
B:页面与dashboard服务器建立长连接,以eventStream类型实时获取服务器聚合后的数据
通过http://localhost:9292/proxy.stream?origin=http://localhost:9090/admin/hystrix.stream访问dashboard的proxy.stream接口
C:dashboard与stream参数指定微服务建立长连接
proxy.stream?origion=? 中origion参数对应的微服务的hystrix接口,直接调用此接口,并建立长连接。
微服务中的hystrix Commond监控服务接口的请求信息,并将信息实时推送给长连接的response中。
dashboard获取微服务推送的数据展示到页面中(页面与dashboard也是长连接)
Turbine
通过hystrix dashboard可以方便的查看微服务指定节点实现的健康信息,但是只能查看具体指定的节点,如果集群中节点太多,那么一个一个查看微服务实例的hystrix健康数据很不方便。Turbine是一个通过
注册中心获取对应集群下的所有微服务实例,然后依次访问每个实例的/hystrix.stream,并收集和聚合所有节点健康信息的聚合工具,因此需要注册中心eureka配置。
集成Turbine
改造上面的demo-springhystrix项目
依赖
pom文件增加以下依赖
    <dependency>
      <!--spring cloud eureka client-->
    <dependency>
      <groupId>org.springframework.cloud</groupId>
      <artifactId>spring-cloud-starter-eureka</artifactId>
    </dependency>
       <!-- turnbine依赖 -->
        <dependency>
            <groupId>org.springframework.cloud</groupId>
            <artifactId>spring-cloud-starter-turbine</artifactId>
        </dependency>
    </dependency>
代码
  @SpringBootApplication
  @EnableHystrixDashboard //启动HystrixDashboard server
  @EnableEurekaClient//eureka client
  @EnableTurbine //启动turbine
  public class HystrixApp
  {
      public static void main( String[] args )
      {
          //启动项目
          SpringApplication.run(HystrixApp.class,args);
      }
  }
配置
配置application.yml
#端口
server:
  port: 9292

#管理接口配置
management:
  context-path: /admin
  port: ${server.port}

#自身配置:
eureka:
  instance:
    preferIpAddress: true
    statusPageUrlPath: ${management.context-path}/info
    healthCheckUrlPath: ${management.context-path}/health
    instance-id: ${spring.cloud.client.ipAddress}:${server.port}
    homePageUrl: https://${spring.cloud.client.ipAddress}:${server.port}
    metadata-map:
      management.port: ${management.port:8081}
  client:
    serviceUrl:
      defaultZone: http://localhost:8761/eureka/

turbine:
   aggregator:
       #cluster必须大写,表示当前的dashboard只支持名为client集群。
       clusterConfig: CLIENT
   #应用名,多个以逗号隔开,表示当前的dashboard只支持名为client,client2的应用
   appConfig: client,client2
   #从客户端的metadata-map的元数据中取key=cluster的值,如果跟上面配置的clusterConfig中的一致才可以访问
   clusterNameExpression: metadata['cluster']
   #turbine.stream由们于dashboard中的turbine提供,它最终访问每个微服务实例的/hystrix.stream,下面配置对应的/hystrix.stream接口
   instanceUrlSuffix: /admin/hystrix.stream
调用dashboard插件turbine提借的/turbine.stream接口,
访问:http://dashboard-hostName:port/hystrix

Hystrix Dashboard中输入:
A:单个微服务实例 http://target-hostName:port/turbine.stream
B:集群:http://dashboard-hostName:port/hystrix
会通过代理访问微服务客户端的:/hystrix.stream
测试
先启动eureka(注册中心)、测试用的微服务
启动成功后访问http://dashboard-hostName:port/hystrix
如:http://localhost:9292/hystrix
其它步骤与访问单个节点一样。
Turbine原理
hystrixServer:只提供页面和代理
stream:指定数据源
hystrixServer通过stream指定的数据源接口与数据源建立长连接,数据源通过长连接实时推送健康信息hystrixServer,hystrixServer把聚合的数据推送到页面展示。
调用dashboard插件turbine提供的/turbine.stream接口,如:http://localhost:9292/admin/turbine.stream?cluster=client
通过dashboard中的turbine,根据cluster指定的集群,从注册中心获取对应的节点,依次与其建立长连接,并获取数据
由于时间问题,没有使用图形化说明,后续会补上
接下来
本节主要说明了hystrix dashboard的使用及简单原因,接下将了解服务路由zuul