机器学习(Machine Learning and Data Mining)CS 5751——Lab1作业记录
Activity3
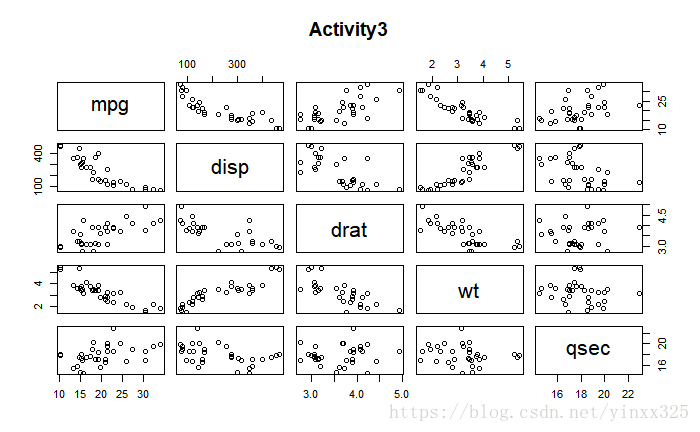
绘制散点图矩阵,显示属性之间的相关性:
mpg,hp,disp,drat,wt,qsec。 使用散点图,评论哪些属性对具有最高的相关性。
plot(mtcars$wt, mtcars$mpg, main="WT vs. MPG", xlab="Weight (1000 lbs)", ylab="Miles/(US) gallon ", pch=19)

cor(mtcars$wt, mtcars$mpg)
Another method to do Activity3
pairs(~mpg+disp+drat+wt+qsec,data=mtcars,main="Activity3")
mydata<-mtcars[,c(1,3,4,5,6,7)]
cor(mydata)
(a)
From picture
WT vs. MPG will be most highest correlation
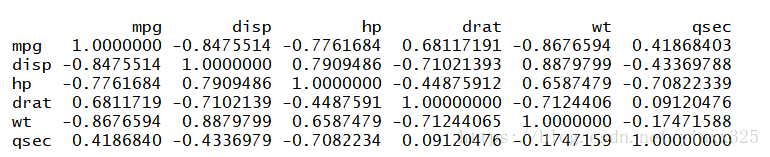
(b)
From the correlation matrix WT vs. MPG will be most highest correlation
Activity4
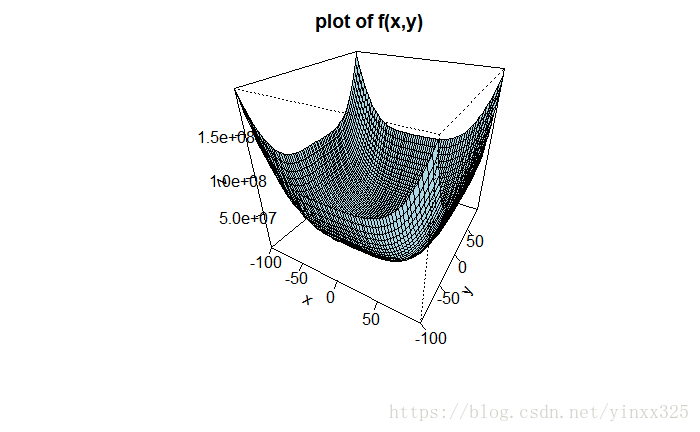
(3)使用R绘制F(x,y)的图表您的绘图必须具有标识所绘制函数的标题。 轴必须正确标记。 您可以使用R的基本图形,也可以使用ggplot。
x <- seq(-100, 100, 3)
y <- x
f <- function(x, y) { r <- (x^2+y-11)^2+(x+y^2-7)^2}
z <- outer(x, y, f)
persp(x, y, z, theta = 30, phi = 30, main = "plot of f(x,y)",col = "lightblue",ticktype="detailed",
nticks=5)