版权声明:本文为博主原创文章,未经博主允许不得转载。 https://blog.csdn.net/qq_33614902/article/details/82622561
传送门:http://www.vision.caltech.edu/Image_Datasets/CaltechPedestrians/
环境:ubuntu,matlab
下载toolbox及评估代码
#!/bin/bash

# download toolbox
git clone https://github.com/pdollar/toolbox pdollar_toolbox

# download evaluation/labeling code
wget http://www.vision.caltech.edu/Image_Datasets/CaltechPedestrians/code/code3.2.1.zip
mkdir code
unzip code3.2.1.zip -d code
rm code3.2.1.zip

#download annotations
cd code
mkdir data-USA
cd data-USA
wget http://www.vision.caltech.edu/Image_Datasets/CaltechPedestrians/datasets/USA/annotations.zip
unzip annotations.zip
rm annotations.zip

#download results
mkdir res
cd  res
list=("VJ" "HOG" "FPDW" "RPN+BF" "MS-CNN" "SDS-RCNN" "TLL-TFA" "F-DNN2+SS" "F-DNN+SS" "GDFL" "PCN" "F-DNN" "AdaptFasterRCNN" "SA-FastRCNN" "UDN+" "FasterRCNN+ATT")
for i in "${list[@]}"
do
    http://www.vision.caltech.edu/Image_Datasets/CaltechPedestrians/datasets/USA/res/${method}.zip
    unzip ${method}.zip
    rm ${method}.zip
done
评估自己的实验结果
一、通用步骤
1、依照官网要求的格式处理自己的数据,放到code/data-USA/res文件夹下。
官网要求的格式:res/目录下新建一个文件夹命名为自己方法的名字(如:my_method),res/my_method/set06/V000/I00029.txt,每个txt文件内存放对应图片的检测结果,每行的格式为[left, top, width, height]
2、用matlab评估
# 第一次使用
p = genpath('../pdollar_toolbox');
addpath(p);
#画MR-FPPI图
将算法结果放入./data-USA/res/XXX/
修改dbEval.m文件,exps只保留Reasonble,变量algs只保留你需要的方法、然后加上自己的方法,变量dataNames只保留UsaTest
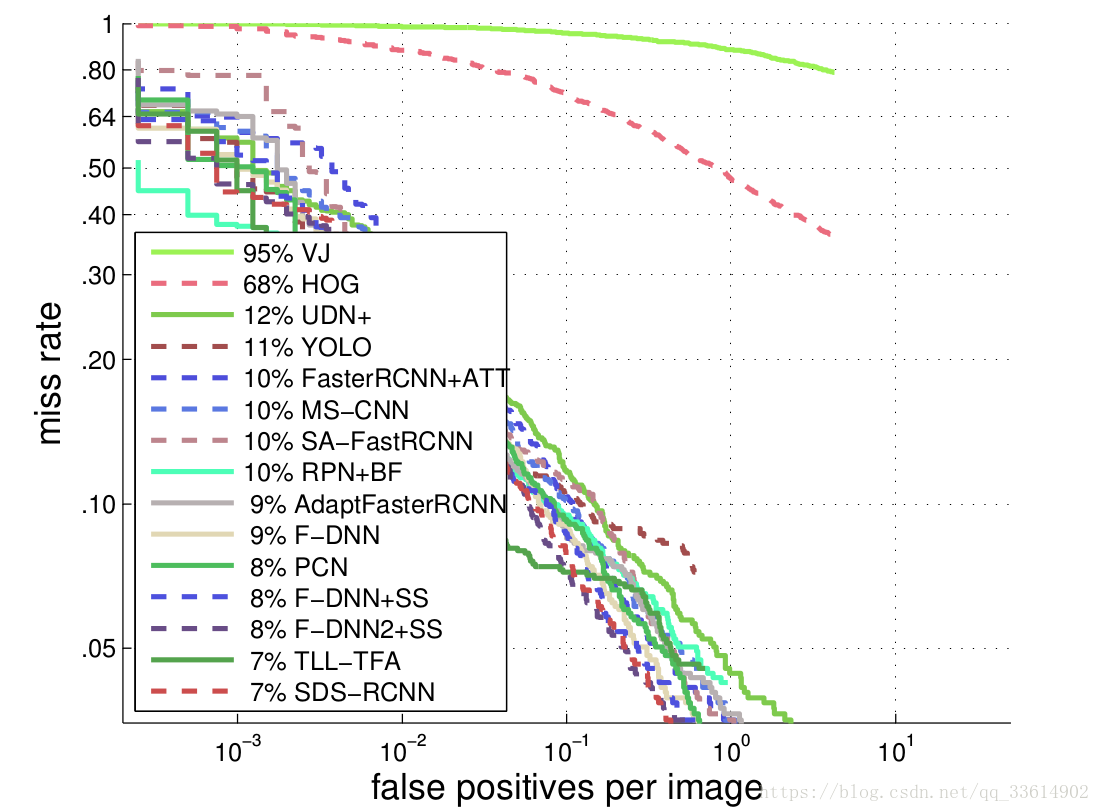
最终生成的结果会存放到code/results文件夹下二、YOLOv3检测行人的结果
exps = Reasonble时,MR=11%,在所有的方法里面排在第13名。
这个结果是博主自己用yolov3只检测行人,然后在评估代码上跑出来的。
如果需要的可以在这里下载:https://download.csdn.net/download/qq_33614902/10659040
将下载后的文件解压放到data-USA/res/文件夹下,然后如下修改dbEval.m文件,最后运行dbEval.m
function dbEval
% Evaluate and plot all pedestrian detection results.
%
% Set parameters by altering this function directly.
%
% USAGE
%  dbEval
%
% INPUTS
%
% OUTPUTS
%
% EXAMPLE
%  dbEval
%
% See also bbGt, dbInfo
%
% Caltech Pedestrian Dataset     Version 3.2.1
% Copyright 2014 Piotr Dollar.  [pdollar-at-gmail.com]
% Licensed under the Simplified BSD License [see external/bsd.txt]

% List of experiment settings: { name, hr, vr, ar, overlap, filter }
%  name     - experiment name
%  hr       - height range to test
%  vr       - visibility range to test
%  ar       - aspect ratio range to test
%  overlap  - overlap threshold for evaluation
%  filter   - expanded filtering (see 3.3 in PAMI11)
exps = {
  'Reasonable',     [50 inf],  [.65 inf], 0,   .5,  1.25
   'All',            [20 inf],  [.2 inf],  0,   .5,  1.25
%   'Scale=large',    [100 inf], [inf inf], 0,   .5,  1.25
   'Scale=near',     [80 inf],  [inf inf], 0,   .5,  1.25
   'Scale=medium',   [30 80],   [inf inf], 0,   .5,  1.25
   'Scale=far',      [20 30],   [inf inf], 0,   .5,  1.25
   'Occ=none',       [50 inf],  [inf inf], 0,   .5,  1.25
   'Occ=partial',    [50 inf],  [.65 1],   0,   .5,  1.25
   'Occ=heavy',      [50 inf],  [.2 .65],  0,   .5,  1.25
%   'Ar=all',         [50 inf],  [inf inf], 0,   .5,  1.25
   'Ar=typical',     [50 inf],  [inf inf],  .1, .5,  1.25
   'Ar=atypical',    [50 inf],  [inf inf], -.1, .5,  1.25
%   'Overlap=25',     [50 inf],  [.65 inf], 0,   .25, 1.25
%   'Overlap=50',     [50 inf],  [.65 inf], 0,   .50, 1.25
%   'Overlap=75',     [50 inf],  [.65 inf], 0,   .75, 1.25
%   'Expand=100',     [50 inf],  [.65 inf], 0,   .5,  1.00
%   'Expand=125',     [50 inf],  [.65 inf], 0,   .5,  1.25
%   'Expand=150',     [50 inf],  [.65 inf], 0,   .5,  1.50
};
exps=cell2struct(exps',{'name','hr','vr','ar','overlap','filter'});

% List of algorithms: { name, resize, color, style }
%  name     - algorithm name (defines data location)
%  resize   - if true rescale height of each box by 100/128
%  color    - algorithm plot color
%  style    - algorithm plot linestyle
n=1000; clrs=zeros(n,3);
for i=1:n, clrs(i,:)=max(.3,mod([78 121 42]*(i+1),255)/255); end
algs = {
  'VJ',               0, clrs(1,:),   '-'
  'HOG',              1, clrs(2,:),   '--'
%   'FtrMine',          1, clrs(3,:),   '-'
%   'Shapelet',         0, clrs(4,:),   '--'
%   'PoseInv',          1, clrs(5,:),   '-'
%   'MultiFtr',         0, clrs(6,:),   '--'
%   'MultiFtr+CSS',     0, clrs(7,:),   '-'
%   'MultiFtr+Motion',  0, clrs(8,:),   '--'
%   'HikSvm',           1, clrs(9,:),   '-'
%   'Pls',              0, clrs(10,:),  '--'
%   'HogLbp',           0, clrs(11,:),  '-'
%   'LatSvm-V1',        0, clrs(12,:),  '--'
%   'LatSvm-V2',        0, clrs(13,:),  '-'
%   'ChnFtrs',          0, clrs(14,:),  '--'
   'FPDW',             0, clrs(15,:),  '-'
%   'FeatSynth',        0, clrs(16,:),  '--'
%   'MultiResC',        0, clrs(17,:),  '-'
%   'CrossTalk',        0, clrs(18,:),  '--'
%   'VeryFast',         0, clrs(19,:),  '-'
%   'ConvNet',          0, clrs(20,:),  '--'
%   'SketchTokens',     0, clrs(21,:),  '-'
%   'Roerei',           0, clrs(22,:),  '--'
%   'AFS',              1, clrs(23,:),  '-'
%   'AFS+Geo',          1, clrs(23,:),  '--'
%   'MLS',              1, clrs(24,:),  '-'
%   'MT-DPM',           0, clrs(25,:),  '-'
%   'MT-DPM+Context',   0, clrs(25,:),  '--'
%   'DBN-Isol',         0, clrs(26,:),  '-'
%   'DBN-Mut',          0, clrs(26,:),  '--'
%   'MF+Motion+2Ped',   0, clrs(27,:),  '-'
%   'MultiResC+2Ped',   0, clrs(27,:),  '--'
%   'MOCO',             0, clrs(28,:),  '-'
%   'ACF',              0, clrs(29,:),  '-'
%   'ACF-Caltech',      0, clrs(29,:),  '--'
%   'ACF+SDt',          0, clrs(30,:),  '-'
%   'FisherBoost',      0, clrs(31,:),  '--'
%   'pAUCBoost',        0, clrs(32,:),  '-'
%   'Franken',          0, clrs(33,:),  '--'
%   'JointDeep',        0, clrs(34,:),  '-'
%   'MultiSDP',         0, clrs(35,:),  '--'
%   'SDN',              0, clrs(36,:),  '-'
%   'RandForest',       0, clrs(37,:),  '--'
%   'WordChannels',     0, clrs(38,:),  '-'
%   'InformedHaar',     0, clrs(39,:),  '--'
%   'SpatialPooling',   0, clrs(40,:),  '-'
%   'SpatialPooling+',  0, clrs(42,:),  '--'
%   'LDCF',             0, clrs(43,:),  '-'
%   'ACF-Caltech+',     0, clrs(44,:),  '--'
%   'Katamari',         0, clrs(45,:),  '-'
%   'NAMC',             0, clrs(46,:),  '--'
%   'FastCF',           0, clrs(47,:),  '-'
%   'TA-CNN',           0, clrs(48,:),  '--'
%   'SCCPriors',        0, clrs(49,:),  '-'
%   'DeepParts',        0, clrs(50,:),  '--'
%   'DeepCascade',      0, clrs(51,:),  '-'
%   'DeepCascade+',     0, clrs(51,:),  '--'
%   'LFOV',             0, clrs(52,:),  '-'
%   'Checkerboards',    0, clrs(53,:),  '--'
%   'Checkerboards+',   0, clrs(53,:),  '-'
%   'CCF',              0, clrs(54,:),  '--'
%   'CCF+CF',           0, clrs(54,:),  '-'
%   'CompACT-Deep',     0, clrs(55,:),  '--'
%   'SCF+AlexNet',      0, clrs(56,:),  '-'
   'SA-FastRCNN',      0, clrs(57,:),  '--'
   'RPN+BF',           0, clrs(58,:),  '-'
   'MS-CNN',           0, clrs(59,:),  '--'
%   'ACF++',            0, clrs(60,:),  '-'
%   'LDCF++',           0, clrs(61,:),  '--'
%   'MRFC+Semantic',    0, clrs(63,:),  '--'
   'F-DNN',            0, clrs(64,:),  '-'
   'F-DNN+SS',         0, clrs(65,:),  '--'
   'UDN+',             0, clrs(66,:),  '-'
   'SDS-RCNN',         0, clrs(67,:),  '--'
   'PCN',              0, clrs(68,:),  '-'
   'F-DNN2+SS',        0, clrs(69,:),  '--'
   'AdaptFasterRCNN',  0, clrs(70,:),  '-'
   'FasterRCNN+ATT',   0, clrs(71,:),  '--'
   'TLL-TFA',          0, clrs(72,:),  '-'
   'YOLO',          0, clrs(73,:),  '--'
  };
algs=cell2struct(algs',{'name','resize','color','style'});

% List of database names
% dataNames = {'UsaTest','UsaTrain','InriaTest',...
%   'TudBrussels','ETH','Daimler','Japan'};
dataNames = {'UsaTest'};
% select databases, experiments and algorithms for evaluation
dataNames = dataNames(1); % select one or more databases for evaluation
exps = exps(:);           % select one or more experiment for evaluation
algs = algs(:);           % select one or more algorithms for evaluation

% remaining parameters and constants
aspectRatio = .41;        % default aspect ratio for all bbs
bnds = [5 5 635 475];     % discard bbs outside this pixel range
plotRoc = 1;              % if true plot ROC else PR curves
plotAlg = 0;              % if true one plot per alg else one plot per exp
plotNum = 15;             % only show best plotNum curves (and VJ and HOG)
samples = 10.^(-2:.25:0); % samples for computing area under the curve
lims = [2e-4 50 .035 1];  % axis limits for ROC plots
bbsShow = 0;              % if true displays sample bbs for each alg/exp
bbsType = 'fp';           % type of bbs to display (fp/tp/fn/dt)

algs0=algs; bnds0=bnds;
for d=1:length(dataNames), dataName=dataNames{d};
  % select algorithms with results for current dataset
  [~,set]=dbInfo(dataName); set=['/set' int2str2(set(1),2)];
  names={algs0.name}; n=length(names); keep=false(1,n);
  for i=1:n, keep(i)=exist([dbInfo '/res/' names{i} set],'dir'); end
  algs=algs0(keep);

  % handle special database specific cases
  if(any(strcmp(dataName,{'InriaTest','TudBrussels','ETH'})))
    bnds=[-inf -inf inf inf]; else bnds=bnds0; end
  if(strcmp(dataName,'InriaTest'))
    i=find(strcmp({algs.name},'FeatSynth'));
    if(~isempty(i)), algs(i).resize=1; end;
  end

  % name for all plots (and also temp directory for results)
  plotName=[fileparts(mfilename('fullpath')) '/results/' dataName];
  if(~exist(plotName,'dir')), mkdir(plotName); end

  % load detections and ground truth and evaluate
  dts = loadDt( algs, plotName, aspectRatio );
  gts = loadGt( exps, plotName, aspectRatio, bnds );
  res = evalAlgs( plotName, algs, exps, gts, dts );

  % plot curves and bbs
  plotExps( res, plotRoc, plotAlg, plotNum, plotName, ...
    samples, lims, reshape([algs.color]',3,[])', {algs.style} );
  plotBbs( res, plotName, bbsShow, bbsType );
end

end

%%%%%%%%%%%%%%%%%%%%%%%%%%%%%%%%%%%%%%%%%%%%%%%%%%%%%%%%%%%%%%%%%%%%%%%%%%%

function res = evalAlgs( plotName, algs, exps, gts, dts )
% Evaluate every algorithm on each experiment
%
% OUTPUTS
%  res    - nGt x nDt cell of all evaluations, each with fields
%   .stra   - string identifying algorithm
%   .stre   - string identifying experiment
%   .gtr    - [n x 1] gt result bbs for each frame [x y w h match]
%   .dtr    - [n x 1] dt result bbs for each frame [x y w h score match]
fprintf('Evaluating: %s\n',plotName); nGt=length(gts); nDt=length(dts);
res=repmat(struct('stra',[],'stre',[],'gtr',[],'dtr',[]),nGt,nDt);
for g=1:nGt
  for d=1:nDt
    gt=gts{g}; dt=dts{d}; n=length(gt); assert(length(dt)==n);
    stra=algs(d).name; stre=exps(g).name;
    fName = [plotName '/ev-' [stre '-' stra] '.mat'];
    if(exist(fName,'file')), R=load(fName); res(g,d)=R.R; continue; end
    fprintf('\tExp %i/%i, Alg %i/%i: %s/%s\n',g,nGt,d,nDt,stre,stra);
    hr = exps(g).hr.*[1/exps(g).filter exps(g).filter];
    for f=1:n, bb=dt{f}; dt{f}=bb(bb(:,4)>=hr(1) & bb(:,4)<hr(2),:); end
    [gtr,dtr] = bbGt('evalRes',gt,dt,exps(g).overlap);
    R=struct('stra',stra,'stre',stre,'gtr',{gtr},'dtr',{dtr});
    res(g,d)=R; save(fName,'R');
  end
end
end

function plotExps( res, plotRoc, plotAlg, plotNum, plotName, ...
  samples, lims, colors, styles )
% Plot all ROC or PR curves.
%
% INPUTS
%  res      - output of evalAlgs
%  plotRoc  - if true plot ROC else PR curves
%  plotAlg  - if true one plot per alg else one plot per exp
%  plotNum  - only show best plotNum curves (and VJ and HOG)
%  plotName - filename for saving plots
%  samples  - samples for computing area under the curve
%  lims     - axis limits for ROC plots
%  colors   - algorithm plot colors
%  styles   - algorithm plot linestyles

% Compute (xs,ys) and score (area under the curve) for every exp/alg
[nGt,nDt]=size(res); xs=cell(nGt,nDt); ys=xs; scores=zeros(nGt,nDt);
for g=1:nGt
  for d=1:nDt
    [xs{g,d},ys{g,d},~,score] = ...
      bbGt('compRoc',res(g,d).gtr,res(g,d).dtr,plotRoc,samples);
    if(plotRoc), ys{g,d}=1-ys{g,d}; score=1-score; end
    if(plotRoc), score=exp(mean(log(score))); else score=mean(score); end
    scores(g,d)=score;
  end
end

% Generate plots
if( plotRoc ), fName=[plotName 'Roc']; else fName=[plotName 'Pr']; end
stra={res(1,:).stra}; stre={res(:,1).stre}; scores1=round(scores*100);
if( plotAlg ), nPlots=nDt; else nPlots=nGt; end; plotNum=min(plotNum,nDt);
for p=1:nPlots
  % prepare xs1,ys1,lgd1,colors1,styles1,fName1 according to plot type
  if( plotAlg )
    xs1=xs(:,p); ys1=ys(:,p); fName1=[fName stra{p}]; lgd1=stre;
    for g=1:nGt, lgd1{g}=sprintf('%2i%% %s',scores1(g,p),stre{g}); end
    colors1=uniqueColors(1,max(10,nGt)); styles1=repmat({'-','--'},1,nGt);
  else
    xs1=xs(p,:); ys1=ys(p,:); fName1=[fName stre{p}]; lgd1=stra;
    for d=1:nDt, lgd1{d}=sprintf('%2i%% %s',scores1(p,d),stra{d}); end
    kp=[find(strcmp(stra,'VJ')) find(strcmp(stra,'HOG')) 1 1];
    [~,ord]=sort(scores(p,:)); kp=ord==kp(1)|ord==kp(2);
    j=find(cumsum(~kp)>=plotNum-2); kp(1:j(1))=1; ord=fliplr(ord(kp));
    xs1=xs1(ord); ys1=ys1(ord); lgd1=lgd1(ord); colors1=colors(ord,:);
    styles1=styles(ord); f=fopen([fName1 '.txt'],'w');
    for d=1:nDt, fprintf(f,'%s %f\n',stra{d},scores(p,d)); end; fclose(f);
  end
  % plot curves and finalize display
  figure(1); clf; grid on; hold on; n=length(xs1); h=zeros(1,n);
  for i=1:n, h(i)=plot(xs1{i},ys1{i},'Color',colors1(i,:),...
      'LineStyle',styles1{i},'LineWidth',2); end
  if( plotRoc )
    yt=[.05 .1:.1:.5 .64 .8]; ytStr=int2str2(yt*100,2);
    for i=1:length(yt), ytStr{i}=['.' ytStr{i}]; end
    set(gca,'XScale','log','YScale','log',...
      'YTick',[yt 1],'YTickLabel',[ytStr '1'],...
      'XMinorGrid','off','XMinorTic','off',...
      'YMinorGrid','off','YMinorTic','off');
    xlabel('false positives per image','FontSize',14);
    ylabel('miss rate','FontSize',14); axis(lims);
  else
    x=1; for i=1:n, x=max(x,max(xs1{i})); end, x=min(x-mod(x,.1),1.0);
    y=.8; for i=1:n, y=min(y,min(ys1{i})); end, y=max(y-mod(y,.1),.01);
    xlim([0, x]); ylim([y, 1]); set(gca,'xtick',0:.1:1);
    xlabel('Recall','FontSize',14); ylabel('Precision','FontSize',14);
  end
  if(~isempty(lgd1)), legend(h,lgd1,'Location','sw','FontSize',10); end
  % save figure to disk (uncomment pdfcrop commands to automatically crop)
  [o,~]=system('pdfcrop'); if(o==127), setenv('PATH',...
      [getenv('PATH') ':/Library/TeX/texbin/:/usr/local/bin/']); end
  savefig(fName1,1,'pdf','-r300','-fonts'); close(1); f1=[fName1 '.pdf'];
  system(['pdfcrop -margins ''-30 -20 -50 -10 '' ' f1 ' ' f1]);
end

end

function plotBbs( res, plotName, pPage, type )
% This function plots sample fp/tp/fn bbs for given algs/exps
if(pPage==0), return; end; [nGt,nDt]=size(res);
% construct set/vid/frame index for each image
[~,setIds,vidIds,skip]=dbInfo;
k=length(res(1).gtr); is=zeros(k,3); k=0;
for s=1:length(setIds)
  for v=1:length(vidIds{s})
    A=loadVbb(s,v); s1=setIds(s); v1=vidIds{s}(v);
    for f=skip-1:skip:A.nFrame-1, k=k+1; is(k,:)=[s1 v1 f]; end
  end
end
for g=1:nGt
  for d=1:nDt
    % augment each bb with set/video/frame index and flatten
    dtr=res(g,d).dtr; gtr=res(g,d).gtr;
    for i=1:k
      dtr{i}(:,7)=is(i,1); dtr{i}(:,8)=is(i,2); dtr{i}(:,9)=is(i,3);
      gtr{i}(:,6)=is(i,1); gtr{i}(:,7)=is(i,2); gtr{i}(:,8)=is(i,3);
      dtr{i}=dtr{i}'; gtr{i}=gtr{i}';
    end
    dtr=[dtr{:}]'; dtr=dtr(dtr(:,6)~=-1,:);
    gtr=[gtr{:}]'; gtr=gtr(gtr(:,5)~=-1,:);
    % get bb, ind, bbo, and indo according to type
    if( strcmp(type,'fn') )
      keep=gtr(:,5)==0; ord=randperm(sum(keep));
      bbCol='r'; bboCol='y'; bbLst='-'; bboLst='--';
      bb=gtr(:,1:4); ind=gtr(:,6:8); bbo=dtr(:,1:6); indo=dtr(:,7:9);
    else
      switch type
        case 'dt', bbCol='y'; keep=dtr(:,6)>=0;
        case 'fp', bbCol='r'; keep=dtr(:,6)==0;
        case 'tp', bbCol='y'; keep=dtr(:,6)==1;
      end
      [~,ord]=sort(dtr(keep,5),'descend');
      bboCol='g'; bbLst='--'; bboLst='-';
      bb=dtr(:,1:6); ind=dtr(:,7:9); bbo=gtr(:,1:4); indo=gtr(:,6:8);
    end
    % prepare and display
    n=sum(keep); bbo1=cell(1,n); O=ones(1,size(indo,1));
    ind=ind(keep,:); bb=bb(keep,:); ind=ind(ord,:); bb=bb(ord,:);
    for f=1:n, bbo1{f}=bbo(all(indo==ind(O*f,:),2),:); end
    f=[plotName res(g,d).stre res(g,d).stra '-' type];
    plotBbSheet( bb, ind, bbo1,'fName',f,'pPage',pPage,'bbCol',bbCol,...
      'bbLst',bbLst,'bboCol',bboCol,'bboLst',bboLst );
  end
end
end

function plotBbSheet( bb, ind, bbo, varargin )
% Draw sheet of bbs.
%
% USAGE
%  plotBbSheet( R, varargin )
%
% INPUTS
%  bb       - [nx4] bbs to display
%  ind      - [nx3] the set/video/image number for each bb
%  bbo      - {nx1} cell of other bbs for each image (optional)
%  varargin - prm struct or name/value list w following fields:
%   .fName    - ['REQ'] base file to save to
%   .pPage    - [1] num pages
%   .mRows    - [5] num rows / page
%   .nCols    - [9] num cols / page
%   .scale    - [2] size of image region to crop relative to bb
%   .siz0     - [100 50] target size of each bb
%   .pad      - [4] amount of space between cells
%   .bbCol    - ['g'] bb color
%   .bbLst    - ['-'] bb LineStyle
%   .bboCol   - ['r'] bbo color
%   .bboLst   - ['--'] bbo LineStyle
dfs={'fName','REQ', 'pPage',1, 'mRows',5, 'nCols',9, 'scale',1.5, ...
  'siz0',[100 50], 'pad',8, 'bbCol','g', 'bbLst','-', ...
  'bboCol','r', 'bboLst','--' };
[fName,pPage,mRows,nCols,scale,siz0,pad,bbCol,bbLst, ...
  bboCol,bboLst] = getPrmDflt(varargin,dfs);
n=size(ind,1); indAll=ind; bbAll=bb; bboAll=bbo;
for page=1:min(pPage,ceil(n/mRows/nCols))
  Is = zeros(siz0(1)*scale,siz0(2)*scale,3,mRows*nCols,'uint8');
  bbN=[]; bboN=[]; labels=repmat({''},1,mRows*nCols);
  for f=1:mRows*nCols
    % get fp bb (bb), double size (bb2), and other bbs (bbo)
    f0=f+(page-1)*mRows*nCols; if(f0>n), break, end
    [col,row]=ind2sub([nCols mRows],f);
    ind=indAll(f0,:); bb=bbAll(f0,:); bbo=bboAll{f0};
    hr=siz0(1)/bb(4); wr=siz0(2)/bb(3); mr=min(hr,wr);
    bb2 = round(bbApply('resize',bb,scale*hr/mr,scale*wr/mr));
    bbo=bbApply('intersect',bbo,bb2); bbo=bbo(bbApply('area',bbo)>0,:);
    labels{f}=sprintf('%i/%i/%i',ind(1),ind(2),ind(3));
    % normalize bb and bbo for siz0*scale region, then shift
    bb=bbApply('shift',bb,bb2(1),bb2(2)); bb(:,1:4)=bb(:,1:4)*mr;
    bbo=bbApply('shift',bbo,bb2(1),bb2(2)); bbo(:,1:4)=bbo(:,1:4)*mr;
    xdel=-pad*scale-(siz0(2)+pad*2)*scale*(col-1);
    ydel=-pad*scale-(siz0(1)+pad*2)*scale*(row-1);
    bb=bbApply('shift',bb,xdel,ydel); bbN=[bbN; bb]; %#ok<AGROW>
    bbo=bbApply('shift',bbo,xdel,ydel); bboN=[bboN; bbo]; %#ok<AGROW>
    % load and crop image region
    sr=seqIo(sprintf('%s/videos/set%02i/V%03i',dbInfo,ind(1),ind(2)),'r');
    sr.seek(ind(3)); I=sr.getframe(); sr.close();
    I=bbApply('crop',I,bb2,'replicate');
    I=uint8(imResample(double(I{1}),siz0*scale));
    Is(:,:,:,f)=I;
  end
  % now plot all and save
  prm=struct('hasChn',1,'padAmt',pad*2*scale,'padEl',0,'mm',mRows,...
    'showLines',0,'labels',{labels});
  h=figureResized(.9,1); clf; montage2(Is,prm); hold on;
  bbApply('draw',bbN,bbCol,2,bbLst); bbApply('draw',bboN,bboCol,2,bboLst);
  savefig([fName int2str2(page-1,2)],h,'png','-r200','-fonts'); close(h);
  if(0), save([fName int2str2(page-1,2) '.mat'],'Is'); end
end
end

%%%%%%%%%%%%%%%%%%%%%%%%%%%%%%%%%%%%%%%%%%%%%%%%%%%%%%%%%%%%%%%%%%%%%%%%%%%

function A = loadVbb( s, v )
% Load given annotation (caches AS for speed).
persistent AS pth sIds vIds; [pth1,sIds1,vIds1]=dbInfo;
if(~strcmp(pth,pth1) || ~isequal(sIds,sIds1) || ~isequal(vIds,vIds1))
  [pth,sIds,vIds]=dbInfo; AS=cell(length(sIds),1e3); end
A=AS{s,v}; if(~isempty(A)), return; end
fName=@(s,v) sprintf('%s/annotations/set%02i/V%03i',pth,s,v);
A=vbb('vbbLoad',fName(sIds(s),vIds{s}(v))); AS{s,v}=A;
end

function gts = loadGt( exps, plotName, aspectRatio, bnds )
% Load ground truth of all experiments for all frames.
fprintf('Loading ground truth: %s\n',plotName);
nExp=length(exps); gts=cell(1,nExp);
[~,setIds,vidIds,skip] = dbInfo;
for i=1:nExp
  gName = [plotName '/gt-' exps(i).name '.mat'];
  if(exist(gName,'file')), gt=load(gName); gts{i}=gt.gt; continue; end
  fprintf('\tExperiment #%d: %s\n', i, exps(i).name);
  gt=cell(1,100000); k=0; lbls={'person','person?','people','ignore'};
  filterGt = @(lbl,bb,bbv) filterGtFun(lbl,bb,bbv,...
    exps(i).hr,exps(i).vr,exps(i).ar,bnds,aspectRatio);
  for s=1:length(setIds)
    for v=1:length(vidIds{s})
      A = loadVbb(s,v);
      for f=skip-1:skip:A.nFrame-1
        bb = vbb('frameAnn',A,f+1,lbls,filterGt); ids=bb(:,5)~=1;
        bb(ids,:)=bbApply('resize',bb(ids,:),1,0,aspectRatio);
        k=k+1; gt{k}=bb;
      end
    end
  end
  gt=gt(1:k); gts{i}=gt; save(gName,'gt','-v6');
end

  function p = filterGtFun( lbl, bb, bbv, hr, vr, ar, bnds, aspectRatio )
    p=strcmp(lbl,'person'); h=bb(4); p=p & (h>=hr(1) & h<hr(2));
    if(all(bbv==0)), vf=inf; else vf=bbv(3).*bbv(4)./(bb(3)*bb(4)); end
    p=p & vf>=vr(1) & vf<=vr(2);
    if(ar~=0), p=p & sign(ar)*abs(bb(3)./bb(4)-aspectRatio)<ar; end
    p = p & bb(1)>=bnds(1) & (bb(1)+bb(3)<=bnds(3));
    p = p & bb(2)>=bnds(2) & (bb(2)+bb(4)<=bnds(4));
  end
end

function dts = loadDt( algs, plotName, aspectRatio )
% Load detections of all algorithm for all frames.
fprintf('Loading detections: %s\n',plotName);
nAlg=length(algs); dts=cell(1,nAlg);
[~,setIds,vidIds,skip] = dbInfo;
for i=1:nAlg
  aName = [plotName '/dt-' algs(i).name '.mat'];
  if(exist(aName,'file')), dt=load(aName); dts{i}=dt.dt; continue; end
  fprintf('\tAlgorithm #%d: %s\n', i, algs(i).name);
  dt=cell(1,100000); k=0; aDir=[dbInfo '/res/' algs(i).name];
  if(algs(i).resize), resize=100/128; else resize=1; end
  for s=1:length(setIds), s1=setIds(s);
    for v=1:length(vidIds{s}), v1=vidIds{s}(v);
      A=loadVbb(s,v); frames=skip-1:skip:A.nFrame-1;
      vName=sprintf('%s/set%02d/V%03d',aDir,s1,v1);
      if(~exist([vName '.txt'],'file'))
        % consolidate bbs for video into single text file
        bbs=cell(length(frames),1);
        for f=1:length(frames)
          fName = sprintf('%s/I%05d.txt',vName,frames(f));
          if(~exist(fName,'file')), error(['file not found:' fName]); end
          bb=load(fName,'-ascii'); if(isempty(bb)), bb=zeros(0,5); end
          if(size(bb,2)~=5), error('incorrect dimensions'); end
          bbs{f}=[ones(size(bb,1),1)*(frames(f)+1) bb];
        end
        for f=frames, delete(sprintf('%s/I%05d.txt',vName,f)); end
        bbs=cell2mat(bbs); dlmwrite([vName '.txt'],bbs); rmdir(vName,'s');
      end
      bbs=load([vName '.txt'],'-ascii');
      for f=frames, bb=bbs(bbs(:,1)==f+1,2:6);
        bb=bbApply('resize',bb,resize,0,aspectRatio); k=k+1; dt{k}=bb;
      end
    end
  end
  dt=dt(1:k); dts{i}=dt; save(aName,'dt','-v6');
end
end
最后的结果: