这里,我们主要用到的是matplotlib中的annotate功能,它原本是来给图像中的某个点作标注的。
- 语法
annotate语法说明 :annotate(s=’str’ ,xy=(x,y) ,xytext=(l1,l2) ,..)
s 为注释文本内容
xy 为指向注释的源坐标点
xytext 为注释文字的坐标位置
xycoords 参数如下:
- figure points points from the lower left of the figure 点在图左下方
- figure pixels pixels from the lower left of the figure 图左下角的像素
- figure fraction fraction of figure from lower left 左下角数字部分
- axes points points from lower left corner of axes 从左下角点的坐标
- axes pixels pixels from lower left corner of axes 从左下角的像素坐标
- axes fraction fraction of axes from lower left 左下角部分
- data use the coordinate system of the object beinannotated(default) 使用的坐标系统被注释的对象(默认)
polar(theta,r) if not native ‘data’ coordinates textcoords 设置注释文字偏移量
| 参数 | 坐标系 |
| ‘figure points’ | 距离图形左下角的点数量 |
| ‘figure pixels’ | 距离图形左下角的像素数量 |
| ‘figure fraction’ | 0,0 是图形左下角,1,1 是右上角 |
| ‘axes points’ | 距离轴域左下角的点数量 |
| ‘axes pixels’ | 距离轴域左下角的像素数量 |
| ‘axes fraction’ | 0,0 是轴域左下角,1,1 是右上角 |
| ‘data’ | 使用轴域数据坐标系 |
arrowprops #箭头参数,参数类型为字典dict
- width the width of the arrow in points 点箭头的宽度
- headwidth the width of the base of the arrow head in points 在点的箭头底座的宽度
- headlength the length of the arrow head in points 点箭头的长度
- shrink fraction of total length to ‘shrink’ from both ends 总长度为分数“缩水”从两端
- facecolor 箭头颜色
bbox给标题增加外框 ,常用参数如下:
- boxstyle方框外形
- facecolor(简写fc)背景颜色
- edgecolor(简写ec)边框线条颜色
- edgewidth边框线条大小
bbox=dict(boxstyle=’round,pad=0.5’, fc=’yellow’, ec=’k’,lw=1 ,alpha=0.5) #fc为facecolor,ec为edgecolor,lw为lineweight
import matplotlib.pyplot as plt

# 为了处理matplotlib中文乱码
from pylab import mpl
mpl.rcParams['font.sans-serif'] = ['SimHei']
#决策树的字典形式
my_tree={'no surfacing': {0: 'no', 1: {'flippers': {0: 'no', 1: 'yes'}}}}
# feature标签
labels=["no surfacing","flippers"]
# 定义几个结点类型,fc是边框线粗细
decision_node=dict(boxstyle="sawtooth",fc="0.8") # 分支结点,锯齿状
leaf_node=dict(boxstyle="round4",fc="0.8") # 叶子结点,圆矩形
arrow_args=dict(arrowstyle="<-") # 箭头
# 绘制结点
# center_point为文本的中心点,箭头所在的点,parent_point为指向文本的源点,va即vertical align
# ha即horizon align
def plot_node(note_txt,center_point,parent_point,node_type):
create_plot.ax1.annotate(note_txt,xy=parent_point,xycoords="axes fraction",
xytext=center_point,textcoords="axes fraction",
va="center", ha="center",bbox=node_type,arrowprops=arrow_args)
# # 创建图像,这个函数是初始版本,后面会对之进行补充
# def create_plot_1():
# fig=plt.figure(1,facecolor="white")
# fig.clf()
# create_plot_1.ax1=plt.subplot(111,frameon=False)
# # 画分支结点和叶子结点
# plot_node("决策点",(0.5,0.1),(0.1,0.5),decision_node)
# plot_node("叶子结点",(0.8,0.1),(0.3,0.8),leaf_node)
# plt.show()# create_plot_1()我们现在可以实现一个父节点到子节点的树了,现在需要考虑的问题是:
如何在1*1单位的坐标轴中摆放决策树
于是我们需要树的两个很重要的信息:树的深度和树的所有叶子结点树
我们已经生成的树:
{‘no surfacing’: {0: ‘no’, 1: {‘flippers’: {0: ‘no’, 1: ‘yes’}}}}
# 求树的深度
def get_tree_depth(my_tree):
    depth=0
    keys_list=list(my_tree.keys())
    first_str=keys_list[0]           # 第一个决策特征
    second_dict=my_tree[first_str]

    for key in second_dict.keys():
        # 如果某个决策特征划分后的集合还是一个字典,继续划分,也就是递归调用get_tree()
        if type(second_dict[key]).__name__=="dict":
            this_depth=1+get_tree_depth(second_dict[key])
        # 如果某个决策特征划分后的集合不再是一个字典,也就是说不需要再划分了,当前子树的层数为1
        else:
            this_depth=1

        if this_depth>depth:
            depth=this_depth

    return depth


# 求树的叶子结点树,和求树的深度思路类似。
def get_leafs_num(my_tree):
    nums=0
    keys_list=list(my_tree.keys())
    first_str=keys_list[0]           # 第一个决策特征
    second_dict=my_tree[first_str]

    for key in second_dict.keys():
        if type(second_dict[key]).__name__=="dict":
            nums+=get_leafs_num(second_dict[key])
        else:
            nums+=1

    return nums
print(my_tree)
print("树的叶子结点数目为:"+str(get_leafs_num(my_tree)))
print("树的深度为:"+str(get_tree_depth(my_tree))){'no surfacing': {0: 'no', 1: {'flippers': {0: 'no', 1: 'yes'}}}}
树的叶子结点数目为:3
树的深度为:2
### 现在,我们需要的就是根据树的深度和叶子结点数,控制一下在图像中的分布,于是将上述几个画图函数略作修改
代码详解,和这篇博客的博主一样,在看源码时这个地方一直没搞明白,反正看完这个博客,豁然开朗 :)
# 在箭头中间添加对应的特征值
def plot_mid_text(center_point,parent_point,txt_string):
    x_mid=(parent_point[0]-center_point[0])/2.0+center_point[0]
    y_mid=(parent_point[1]-center_point[1])/2.0+center_point[1]
    create_plot.ax1.text(x_mid,y_mid,txt_string)

# 画决策树,逻辑过程,同样是递归实现的
def plot_tree(my_tree,parent_point,node_txt):
    # 计算宽和高
    leafs_num=get_leafs_num(my_tree)
    depth=get_tree_depth(my_tree)

    keys_list=list(my_tree.keys())
    first_str=keys_list[0]

    # 确定当前结点位置。注意:树根不存在父节点
    center_point=(plot_tree.xOff+(1+float(leafs_num))/2.0/plot_tree.totalW,plot_tree.yOff)
    # 在箭头中间添加对应的特征值
    plot_mid_text(center_point,parent_point,node_txt)
    # first_str一定是一个决策特征
    # 画决策结点
    plot_node(first_str,center_point,parent_point,decision_node)

    # 往下一层,yOff相应减少
    second_dict=my_tree[first_str]
    plot_tree.yOff-=1.0/plot_tree.totalD

    for key in second_dict.keys():
        # 如果还需要划分,递归调用本身,参数改变一下即可
        if type(second_dict[key]).__name__=="dict":
            plot_tree(second_dict[key],center_point,str(key))
        # 如果是叶子结点,直接输出
        else:
            plot_tree.xOff+=1.0/plot_tree.totalW
            plot_node(second_dict[key],(plot_tree.xOff,plot_tree.yOff),center_point,leaf_node)
            plot_mid_text((plot_tree.xOff,plot_tree.yOff),center_point,str(key))
    plot_tree.yOff+=1/plot_tree.totalD


# 真正的画决策树,非逻辑
def create_plot(my_tree):
    fig = plt.figure(1, facecolor='white')
    fig.clf()
    axprops = dict(xticks=[], yticks=[])
    create_plot.ax1 = plt.subplot(111, frameon=False)    #no ticks
    #totalW为整树的叶子节点树,totalD为深度
    plot_tree.totalW = float(get_leafs_num(my_tree))
    plot_tree.totalD = float(get_tree_depth(my_tree))
    plot_tree.xOff = -0.5/plot_tree.totalW
    plot_tree.yOff = 1.0
    # 因为开始的根节点并不用划线,因此父节点和当前节点的位置需要重合,利用2中的确定当前节点的位置便为(0.5, 1.0)
    plot_tree(my_tree, (0.5,1.0), '')
    plt.show()
# test
my_tree_1={'no surfacing': {0: 'no', 1: {'flippers': {0: 'no', 1: 'yes'}},2:'maybe'}}
create_plot(my_tree_1)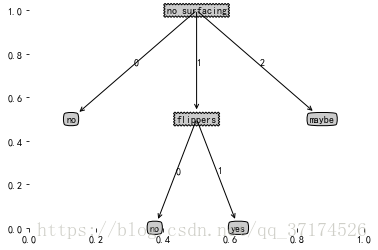
现在,我们已经将决策树从一个嵌套字典的形式转化为了一棵树。 其实,我们没有“显示”地构造这种树也没关系,只要构造了上述嵌套的字典,就可以对测试集进行判断了