1.柱状图与折线图多维数据
较一维加一个y轴坐标
from pyecharts.charts import Bar
from pyecharts import options as opts
bar = Bar()
y1 = [28, 32, 15, 45]
x2 = ['美女', '模特', '公主', '学生']
y2 = [20, 30, 10, 40]
bar.add_xaxis(x2)
bar.add_yaxis('KTV', y1)
bar.add_yaxis('98', y2)
bar.set_global_opts(title_opts=opts.TitleOpts(title='夜总会情况'))
bar.render()
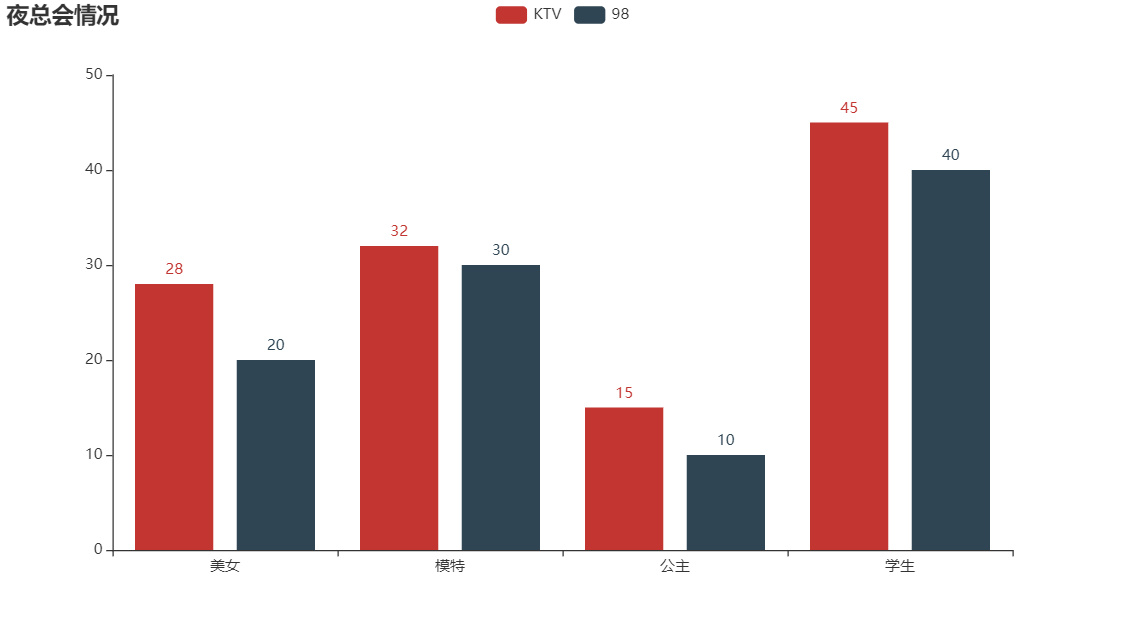
折线图同理,将 Bar改为 Line

2.显示多组柱状图和折线图
from pyecharts.charts import Bar, Grid
from pyecharts import options as opts
from pyecharts.globals import ThemeType

t1 = Bar()
x1 = ['帅哥', '青年', '男神', '男人']
y1 = [28, 32, 15, 45]
t1.add_xaxis(x1)
t1.add_yaxis('KTV', y1)
t1.set_global_opts(title_opts=opts.TitleOpts(title='夜总会情况'), legend_opts=opts.LegendOpts(pos_left="100"))

              设置角标位置

t2 = Bar()
x2 = ['美女', '模特', '公主', '学生']
y2 = [20, 30, 10, 40]
t2.add_xaxis(x2)
t2.add_yaxis('98', y2)
t2.set_global_opts(title_opts=opts.TitleOpts(title='夜总会情况'), legend_opts=opts.LegendOpts(pos_right="20"))

引入网格
g1 = Grid(init_opts=opts.InitOpts(theme=ThemeType.DARK))
g1.add(t1, grid_opts=opts.GridOpts(pos_left="55%"))
              添加并设置位置
g1.add(t2, grid_opts=opts.GridOpts(pos_right="55%"))
g1.render()
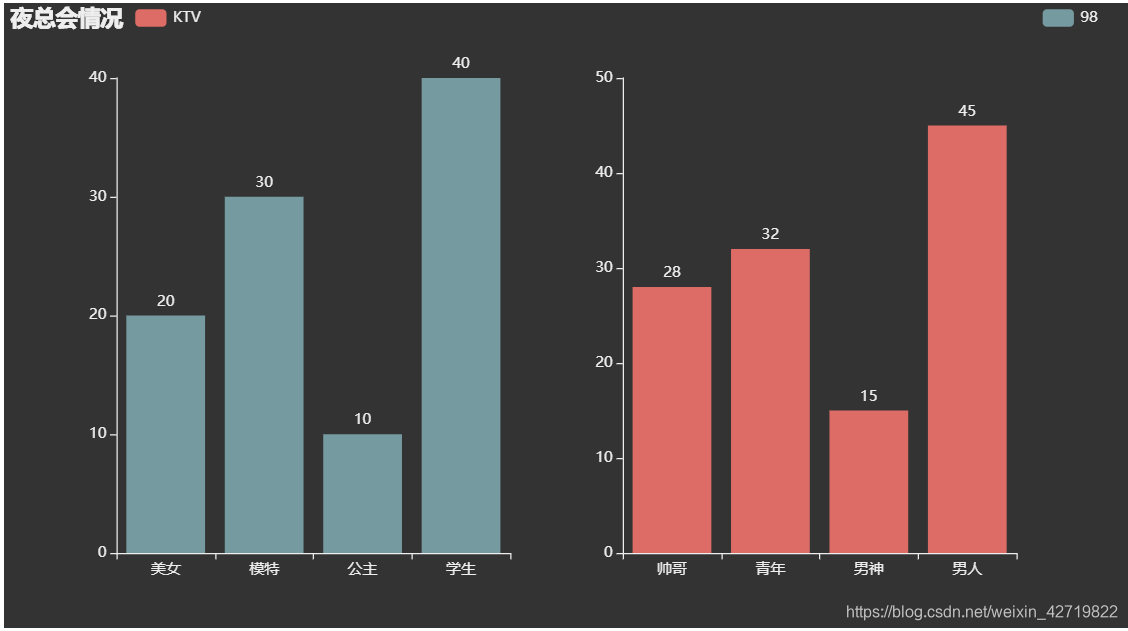
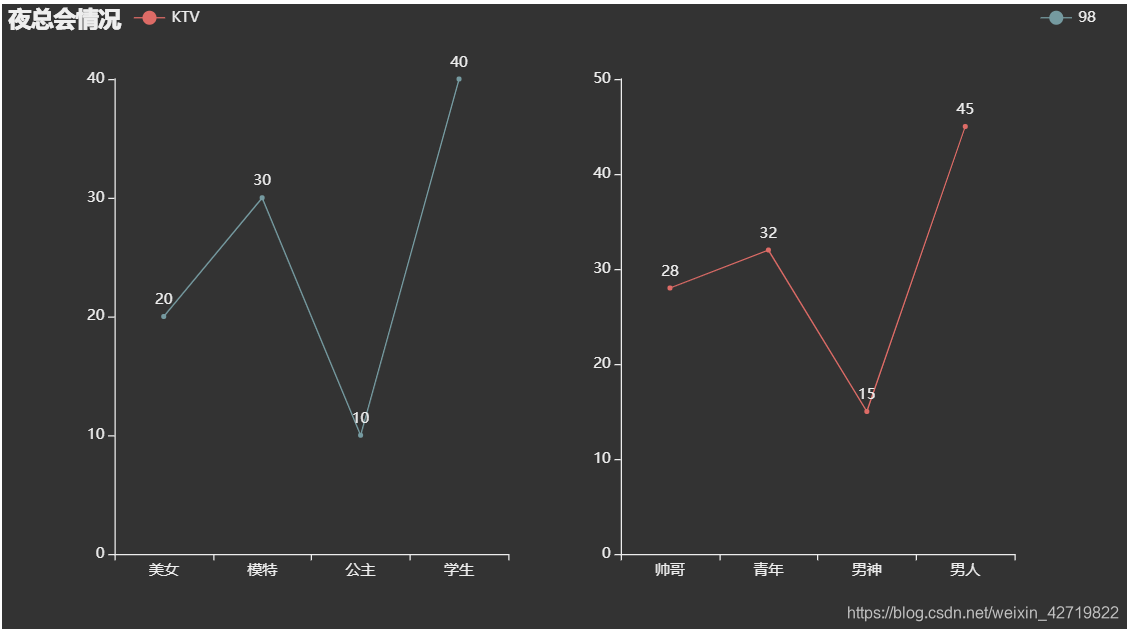
折线图同理,只需将 Bar改为 Line
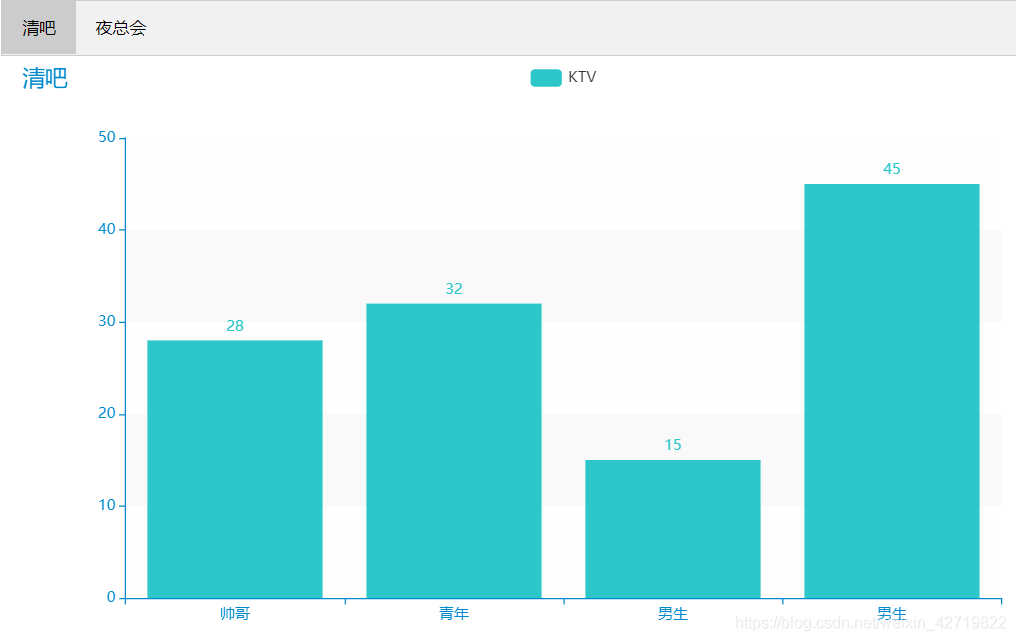
3.设置表格选取图片
from pyecharts.charts import Bar, Tab
from pyecharts import options as opts
from pyecharts.globals import ThemeType

t1 = Bar(init_opts=opts.InitOpts(theme=ThemeType.MACARONS))
x1 = ['帅哥', '青年', '男生', '男生']
y1 = [28, 32, 15, 45]
t1.add_xaxis(x1)
t1.add_yaxis('KTV', y1)
t1.set_global_opts(title_opts=opts.TitleOpts(title='清吧'))

t2 = Bar(init_opts=opts.InitOpts(theme=ThemeType.DARK))
x2 = ['美女', '模特', '公主', '学生']
y2 = [20, 30, 10, 40]
t2.add_yaxis('98', y2)
t2.set_global_opts(title_opts=opts.TitleOpts(title='夜店'))

g1 = Tab()
g1.add(t1, '清吧')
g1.add(t2, '夜总会')
     加入表格根据标题对号入座
g1.render()
4.制作散点图
将 Bar 改为 Scatter即可
5.3D柱状图
from pyecharts.charts import Bar3D
from pyecharts import options as opts
from pyecharts.globals import ThemeType

x = list(range(10))
y = list(range(10))
z = list(range(10))
data = [[x[i], y[i], z[i]] for i in range(len(z))]

生成每组三个数据的二维数组
[[0, 0, 0], [1, 1, 1], [2, 2, 2], [3, 3, 3], [4, 4, 4], [5, 5, 5],
[6, 6, 6], [7, 7, 7], [8, 8, 8], [9, 9, 9]]

t = Bar3D(init_opts=opts.InitOpts(theme=ThemeType.LIGHT))
t.add('', data, xaxis3d_opts=opts.Axis3DOpts(x, type_='category'),
      yaxis3d_opts=opts.Axis3DOpts(y, type_='category'),
      zaxis3d_opts=opts.Axis3DOpts(z, type_='value'))

设置x,y轴为横轴,z轴为竖轴

t.set_global_opts(visualmap_opts=opts.VisualMapOpts(max_=10), title_opts=opts.TitleOpts(title='3D图'))

设置图片的最值

t.render()
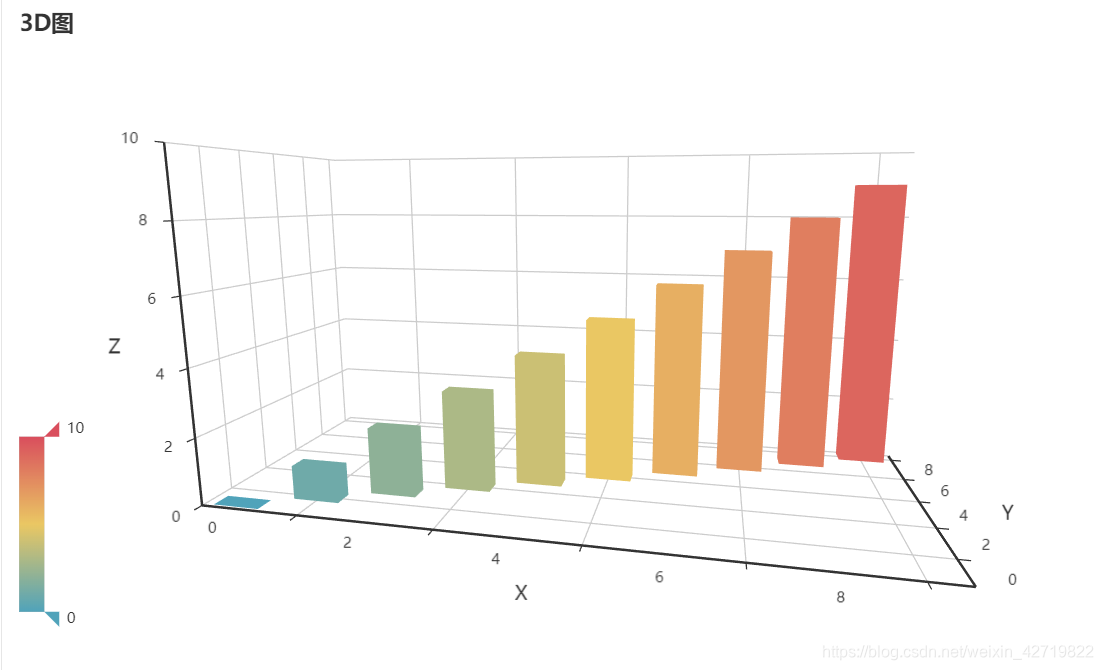
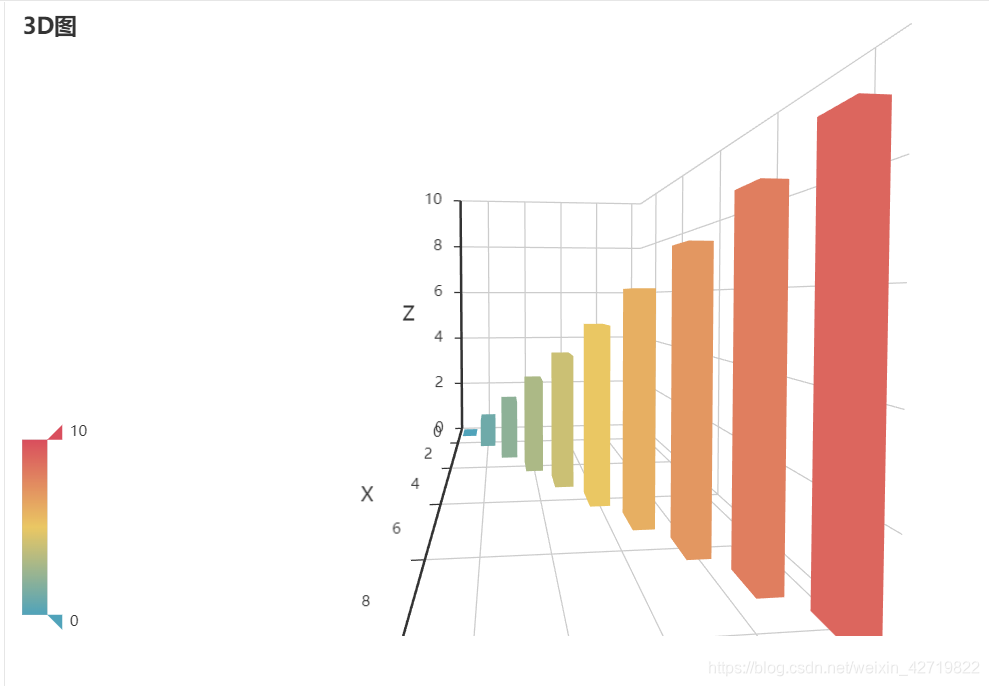
3D图可以360°随意旋转查看
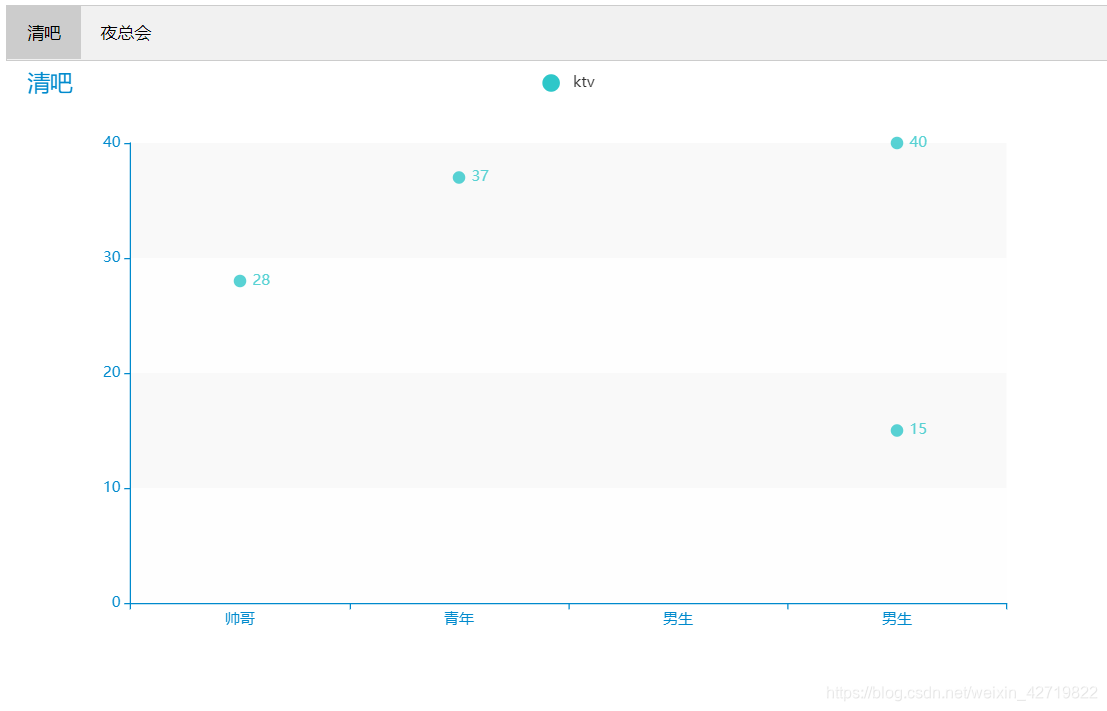
6.生成可缩放移动的图形
from pyecharts.charts import Line, Page
from pyecharts import options as opts
from pyecharts.globals import ThemeType

t1 = Line(init_opts=opts.InitOpts(theme=ThemeType.MACARONS))
x1 = ['帅哥', '青年', '男生', '男生']
y1 = [28, 37, 15, 40]
t1.add_xaxis(x1)
t1.add_yaxis('ktv', y1)
t1.set_global_opts(title_opts=opts.TitleOpts(title='清吧'))

t2 = Line(init_opts=opts.InitOpts(theme=ThemeType.DARK))
x2 = ['美女', '模特', '公主', '学生']
y2 = [20, 30, 10, 40]
t2.add_xaxis(x2)
t2.add_yaxis('98', y2)
t2.set_global_opts(title_opts=opts.TitleOpts(title='夜店'))

page = Page(layout=Page.DraggablePageLayout)
page.add(t1, t2)
page.render()


做出两张图,之后引入Page模块加入
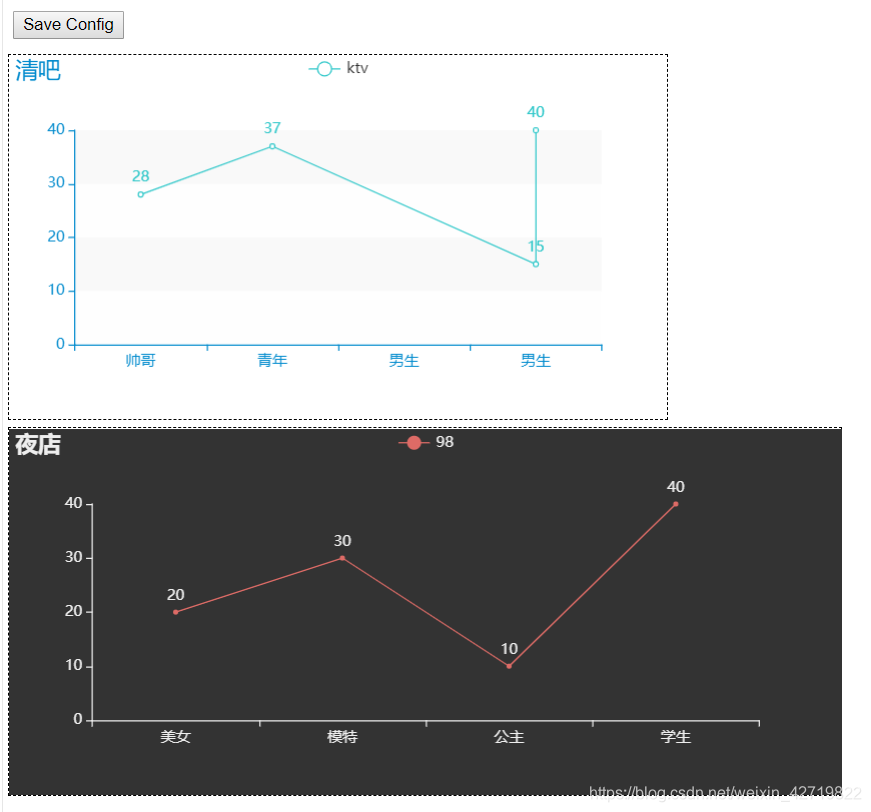
可以保存但保存后不能改变图形
附加部分
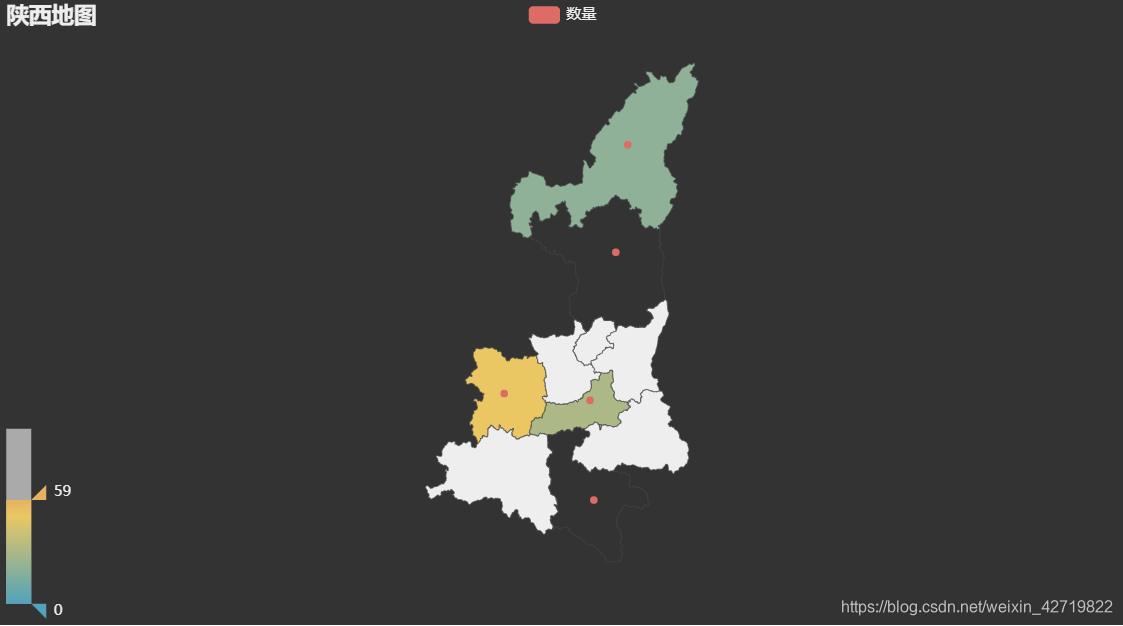
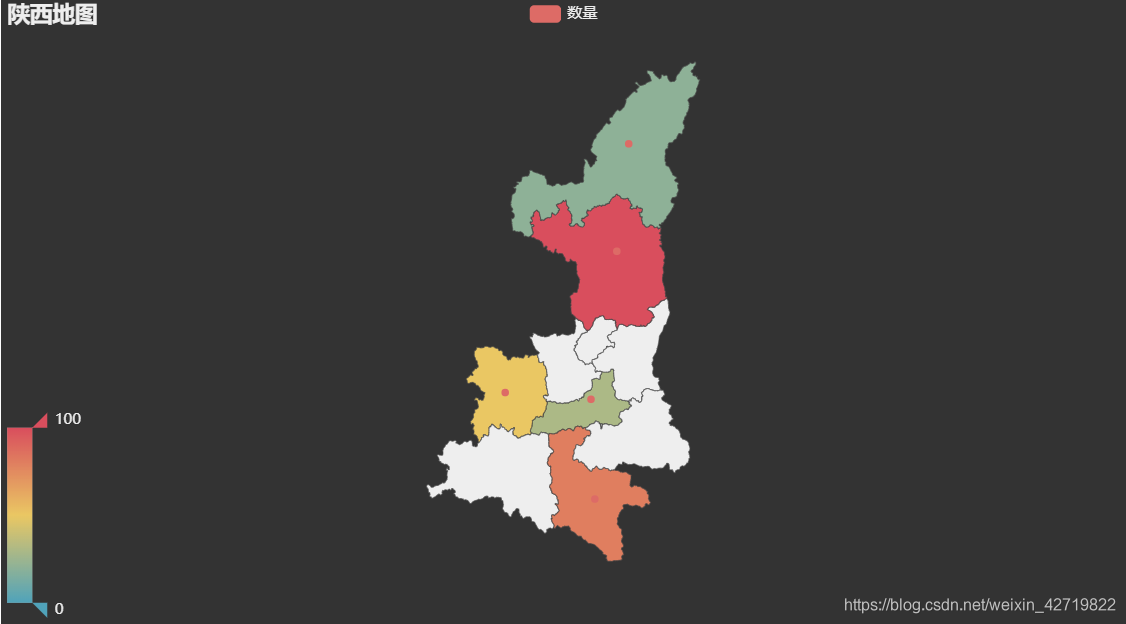
1.地图可视化
这里距离陕西地图
from pyecharts.charts import Map
from pyecharts import options as opts
from pyecharts.globals import ThemeType, ChartType, SymbolType

g0 = Map(init_opts=opts.InitOpts(theme=ThemeType.DARK))
data = [['榆林市', 20], ['延安市', 100], ['安康市', 80], ['西安市', 30], ['宝鸡市', 50]]
g0.add('数量', data, '陕西', is_map_symbol_show=True)

设置是否显示 点

g0.set_series_opts(label_opts=opts.LabelOpts(is_show=False))

设置是否自动显示其中城市名称,注意,市级单位要加 "市"

g0.set_global_opts(title_opts=opts.TitleOpts(title='陕西地图'),
                   visualmap_opts=opts.VisualMapOpts(is_piecewise=True))

设置左下角是否显示图标,此处设置显示

g0.render()


使用 Map函数

当设置不显示图标时,会显示数值滚动条如下
滚动条可拉动,用来根据滚动条范围显示图形
不在范围内则为默认黑色