学习目标:
1.在汽车检测数据集上应用目标检测
2.处理边界框
运行以下单元下载有有助于实现车辆检测的包和依赖项。
import argparse
import os
import matplotlib.pyplot as plt
from matplotlib.pyplot import imshow
import scipy.io
import scipy.misc
import numpy as np
import pandas as pd
import PIL
import tensorflow as tf
from keras import backend as K
from keras.layers import Input, Lambda, Conv2D
from keras.models import load_model, Model
from yolo_utils import read_classes, read_anchors, generate_colors, preprocess_image, draw_boxes, scale_boxes
from yad2k.models.keras_yolo import yolo_head, yolo_boxes_to_corners, preprocess_true_boxes, yolo_loss, yolo_body

%matplotlib inline
1-问题描述
汽车检测系统为了收集数据,在开车时利用车前方的摄像头每隔几秒钟就对行驶的路况拍照,所有图片收集到文件夹中,并对找到的每辆车并画出边框实现检测。下图是车辆边框检测的例子:
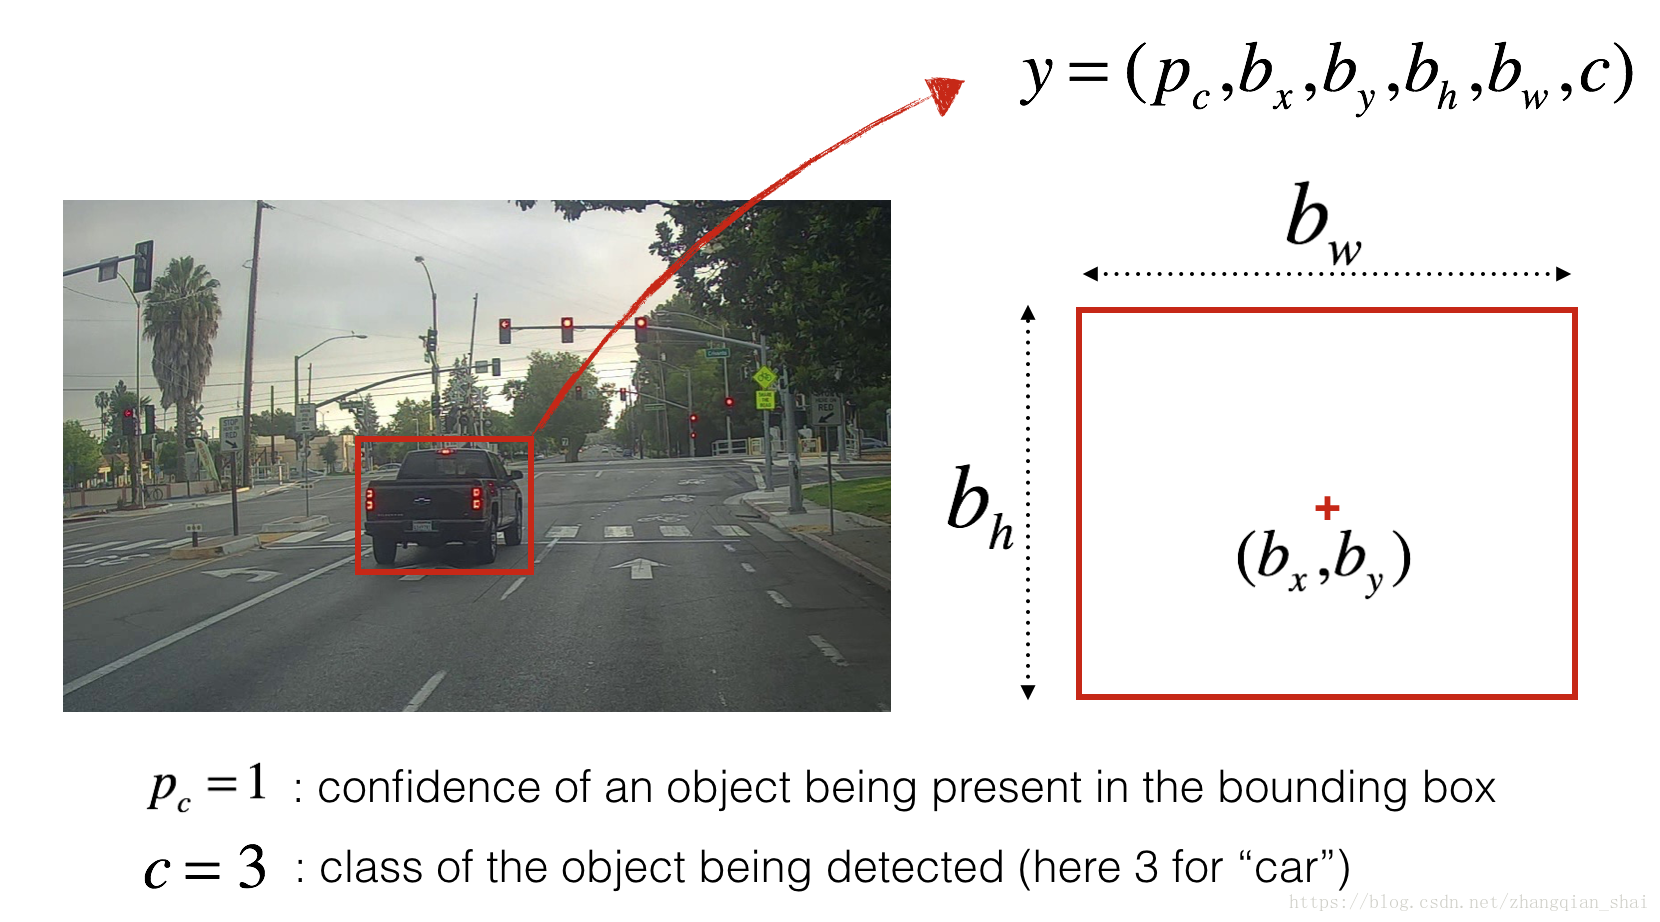
如果想让YOLO识别80种分类,可以将类标签‘c’表示为一个从1~80的整数,或者’c’表示为一个80维的向量,其中一个分量是’1’,其余分量是‘0’。
2-YOLO
YOLO (“you only look once”) 是非常流行的算法,在实现高准确率的同时可以做到实时检测。该算法“只看一次”图片,即它只需要一次前向传播就可以实现检测。在非最大抑制以后,算法输出带有边框的车辆识别图像。
2.1-Model details
第一点:
1.输入是一组图像的形状(m, 608, 608, 3)
2.输出是一个列表包括边框信息和被识别的类。每一个边框信息通过6个 数字表示(p_c, b_x, b_y, b_h, b_w, c)如上述描述。如果你将’c’表达为80维的向量,每个边框信息将包括85个数字。
这里采用5组边框信息。所以YOLO算法架构如下:
IMAGE (m, 608, 608, 3) –> DEEP CNN –> ENCODING (m, 19, 19, 5, 85).
编码内容详细表述如下:
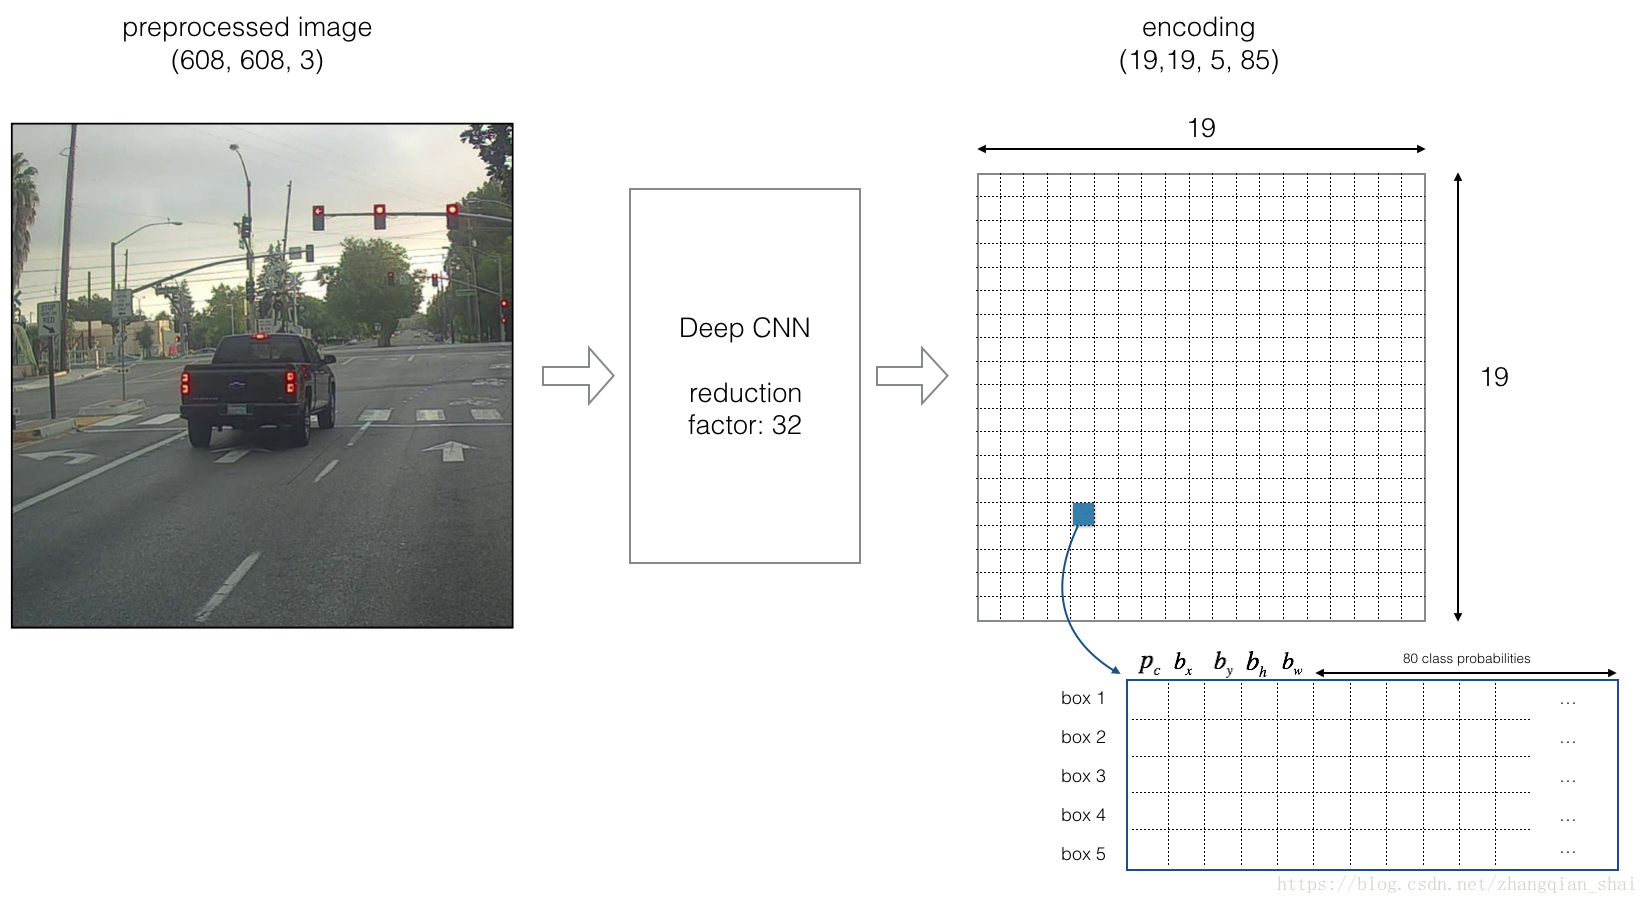
Figure 2 : Encoding architecture for YOLO
如果一个目标的中心/中点落入网格单元,那么此网格单元就负责监测该对象。
这里采用5组边框信息,因此,19*19网格单元中的每一个都编码了5组边框信息。边框信息仅通过宽度和高度定义。
为了简化,这里将形状(19, 19, 5, 85)的最后两个维度压平,得到深度卷机网络输出为(19, 19, 425)。
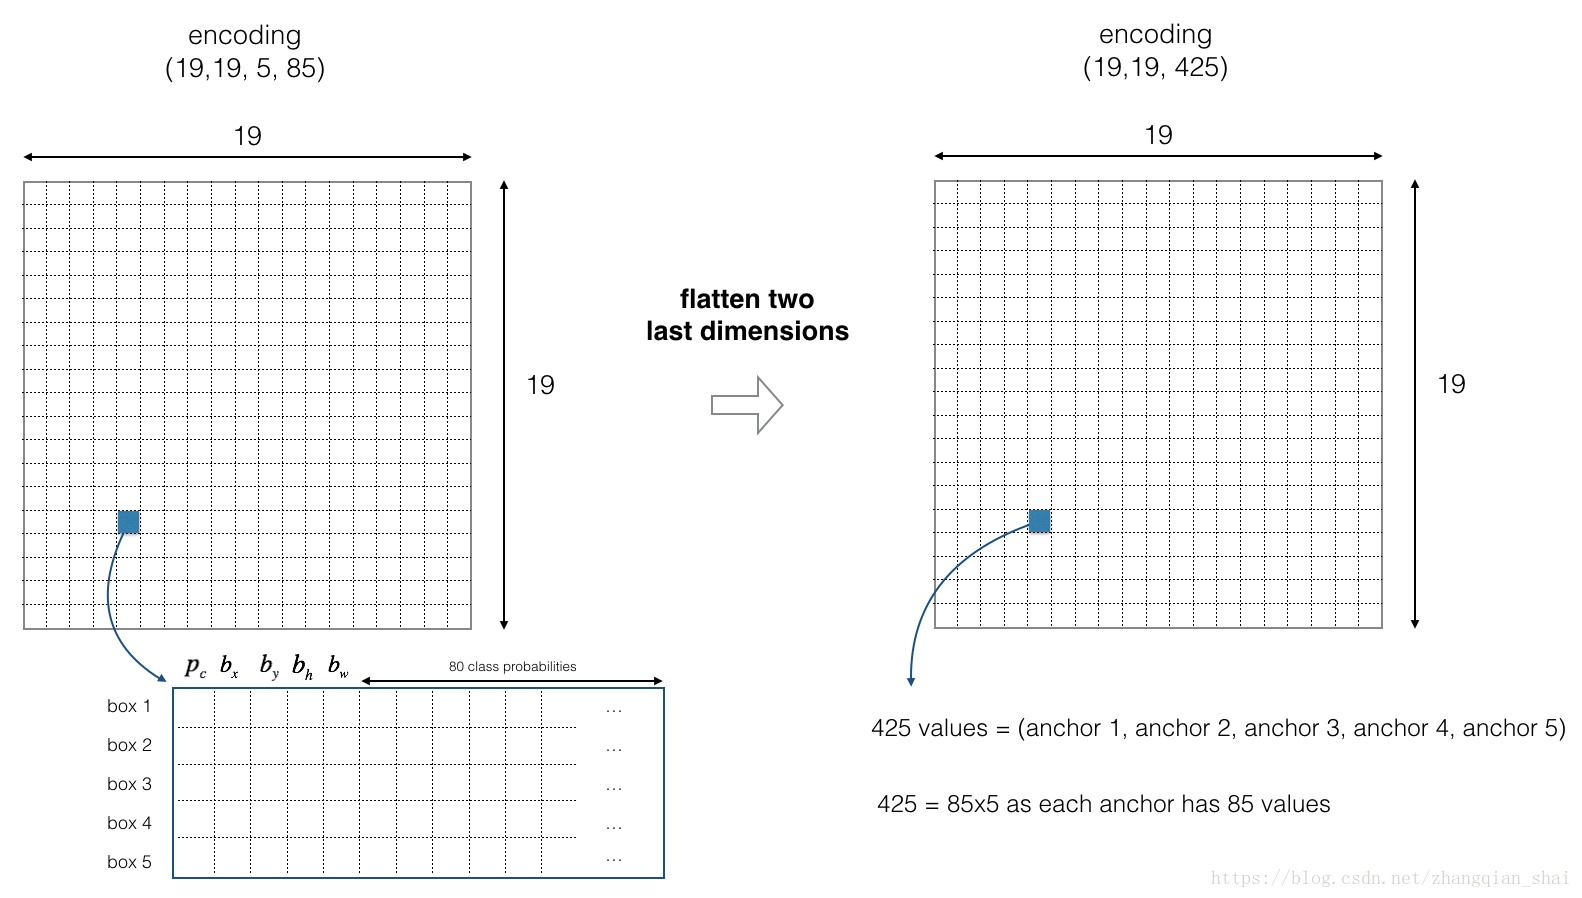
Figure 3 : Flattening the last two last dimensions
现在,对于每个单元格,这里将计算下面结果,并提取该单元格包含某个类的概率。
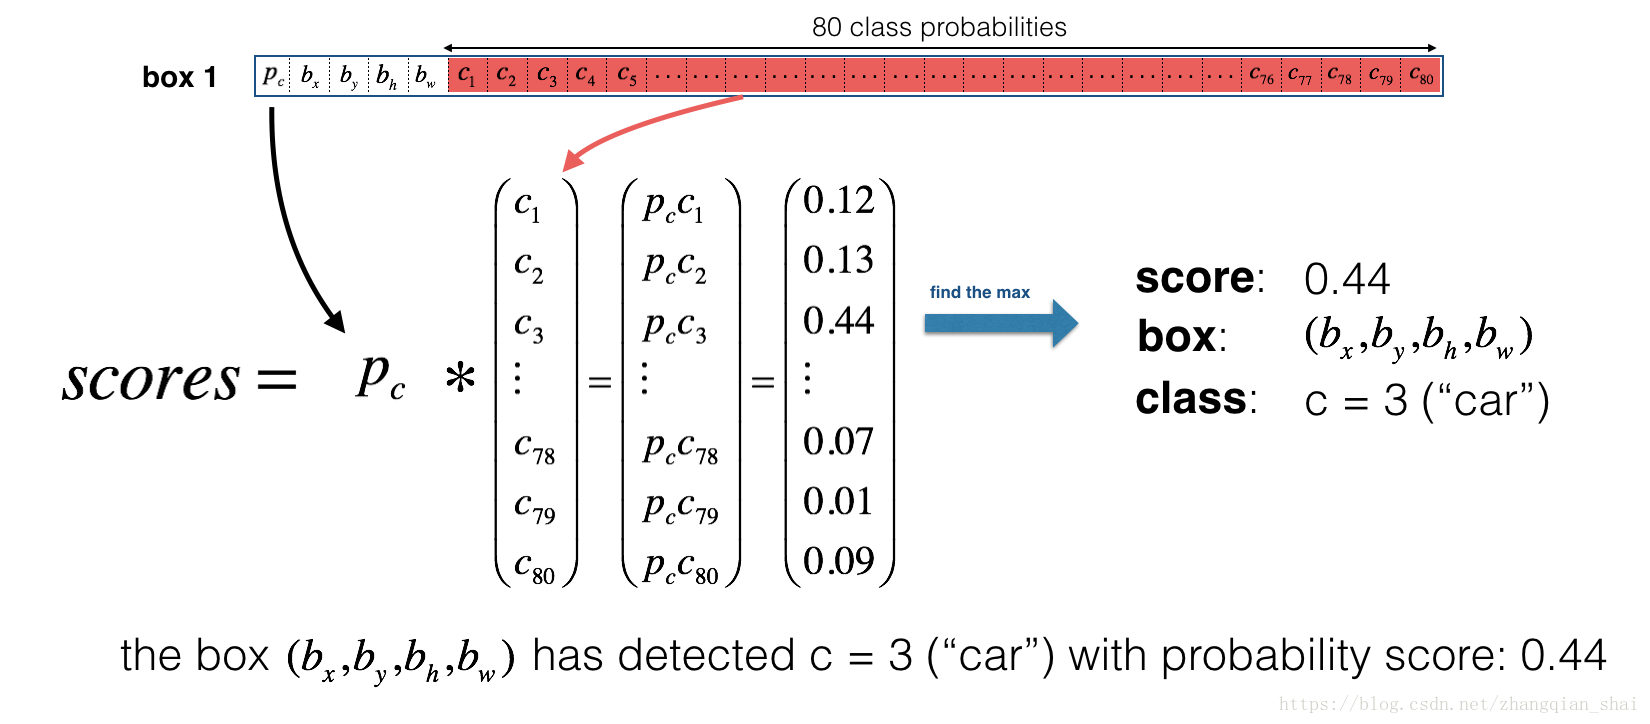
Figure 4 : Find the class detected by each box
这里有一种方法,可将YOLO对图片的预测可视化:
1.对于每个19*19单元格,找出概率得分最大值(在5组边框信息和不同类中取一个最大值)。
2.根据网格单元最可能的对象,对网格进行着色。
效果如下:

Figure 5 : Each of the 19x19 grid cells colored according to which class has the largest predicted probability in that cell.
注意:这里的可视化并不是YOLO算法进行预测的核心,这仅仅是可视化中间结果的方式。
另一种可视化YOLO输出的方法是绘制它的输出边框,可视化结果如下:
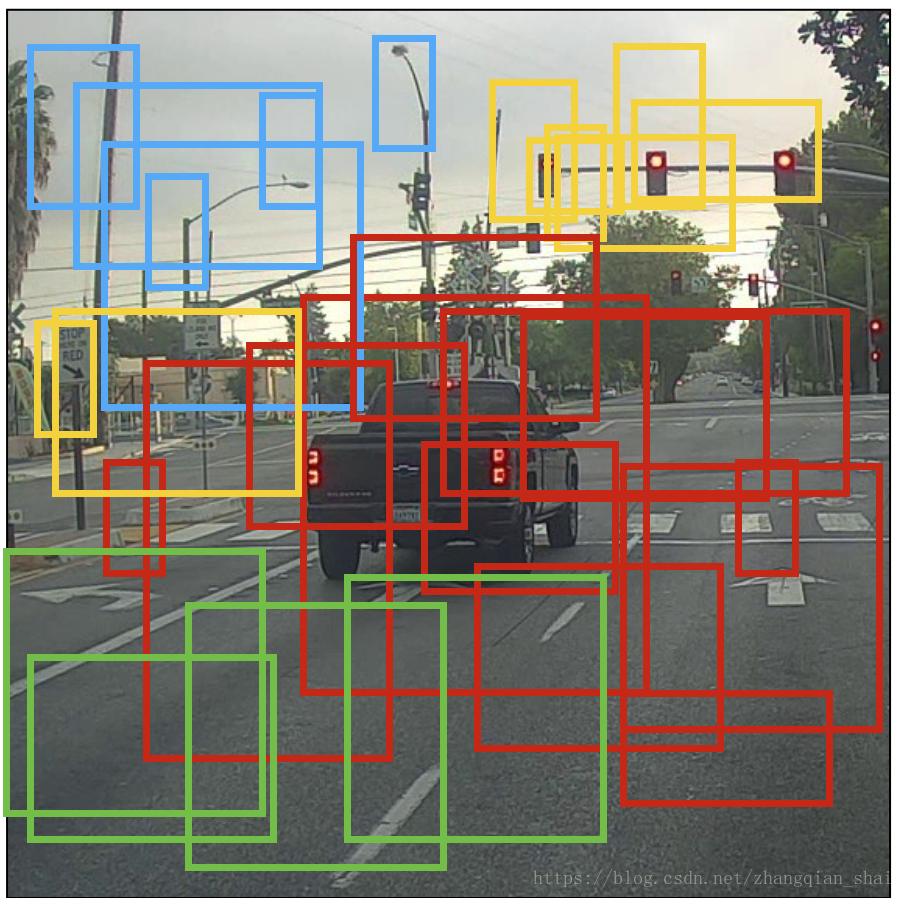
Figure 6 : Each cell gives you 5 boxes. In total, the model predicts: 19x19x5 = 1805 boxes just by looking once at the image (one forward pass through the network)! Different colors denote different classes.
在上图我们绘制了模型所分配的高分辨率的边框,但是边框依然太多。我们希望算法过滤输出更少的监测对象,为此采用非最大抑制。具体步骤如下:
1.删除概率较低的边框(即,该边框不确定某一类的检测)。
2.当多个边框相互重叠并检测相同的对象时,只选择一个边框。
2.2-Filtering with a threshold on class scores
在第一个过滤器中应用“阈值”,这将会删除那些分类概率小于所选阈值的边框。
该模型总共提供了“19x19x5x85”个数字,每个框都有85个数字。将(19、19、5、85)(或(19,19,425))维度张量重新排列为以下变量:
1.box_confidence:维度(19x19, 5, 1)的张量包含p_c(表示某个对象的置信概率),对于每一个在19x19单元格中预测的5个边框的每一个。
2.boxes:维度(19x19, 5, 4)的张量包含(b_x, b_y, b_h, b_w),对于每个单元格中的5个边框信息的每一个。
3.box_class_probs:维度(19x19, 5, 80)的张量包含检测概率(c_1, c_2,…,c_80),对于每个单元格的5个框中的每一个80个类。
练习:实现yolo_filter_boxes().
1.计算单元格包含某个类的概率如4.1所示,代码如下:
a = np.random.randn(19*19, 5, 1)
b = np.random.randn(19*19, 5, 80)
c = a * b # shape of c will be (19*19, 5, 80) 2.在每个单元格中,
a.找到这个最大概率类的索引值(注意:axis=-1)
b.找到对应的单元格概率值(注意:axis=-1)
3.使用阈值进行筛选。如:([0.9, 0.3, 0.4, 0.5, 0.1] < 0.4) returns: [False, True, False, False, True].筛选后你想保留的单元格为”True“.
4.使用Tensorflow实现筛选box_class_scores,boxes 和box_classes ,删除你不想要的单元格。你会得到你要保留的单元格的子集。
代码如下:
def yolo_filter_boxes(box_confidence, boxes, box_class_probs, threshold = .6):
    """Filters YOLO boxes by thresholding on object and class confidence.

    Arguments:
    box_confidence -- tensor of shape (19, 19, 5, 1)
    boxes -- tensor of shape (19, 19, 5, 4)
    box_class_probs -- tensor of shape (19, 19, 5, 80)
    threshold -- real value, if [ highest class probability score < threshold], then get rid of the corresponding box

    Returns:
    scores -- tensor of shape (None,), containing the class probability score for selected boxes
    boxes -- tensor of shape (None, 4), containing (b_x, b_y, b_h, b_w) coordinates of selected boxes
    classes -- tensor of shape (None,), containing the index of the class detected by the selected boxes

    Note: "None" is here because you don't know the exact number of selected boxes, as it depends on the threshold.
    For example, the actual output size of scores would be (10,) if there are 10 boxes.
    """

    # Step 1: Compute box scores
    ### START CODE HERE ### (≈ 1 line)
    box_scores = box_confidence * box_class_probs   # 19x19x5x80 (80 scores)
    ### END CODE HERE ###

    # Step 2: Find the box_classes thanks to the max box_scores, keep track of the corresponding score
    ### START CODE HERE ### (≈ 2 lines)
    box_classes = K.argmax(box_scores ,axis=-1)      # 19x19x5x1 (1 class idx)
    box_class_scores = K.max(box_scores ,axis=-1)    # 19x19x5x1 (1 class score)
    ### END CODE HERE ###

    # Step 3: Create a filtering mask based on "box_class_scores" by using "threshold". The mask should have the
    # same dimension as box_class_scores, and be True for the boxes you want to keep (with probability >= threshold)
    ### START CODE HERE ### (≈ 1 line)
    filtering_mask = box_class_scores >= threshold   # 19x19x5x1 (1 boolean)
    ### END CODE HERE ###

    # Step 4: Apply the mask to scores, boxes and classes
    ### START CODE HERE ### (≈ 3 lines)
    scores = tf.boolean_mask(box_class_scores, filtering_mask)
    boxes = tf.boolean_mask(boxes, filtering_mask)
    classes = tf.boolean_mask(box_classes, filtering_mask)
    ### END CODE HERE ###

    return scores, boxes, classes
2.3-Non-max suppression
即使在对分类分数过滤后,仍然会有很多重叠的框。选择正确框的第二个过滤器称为非最大抑制(NMS)。
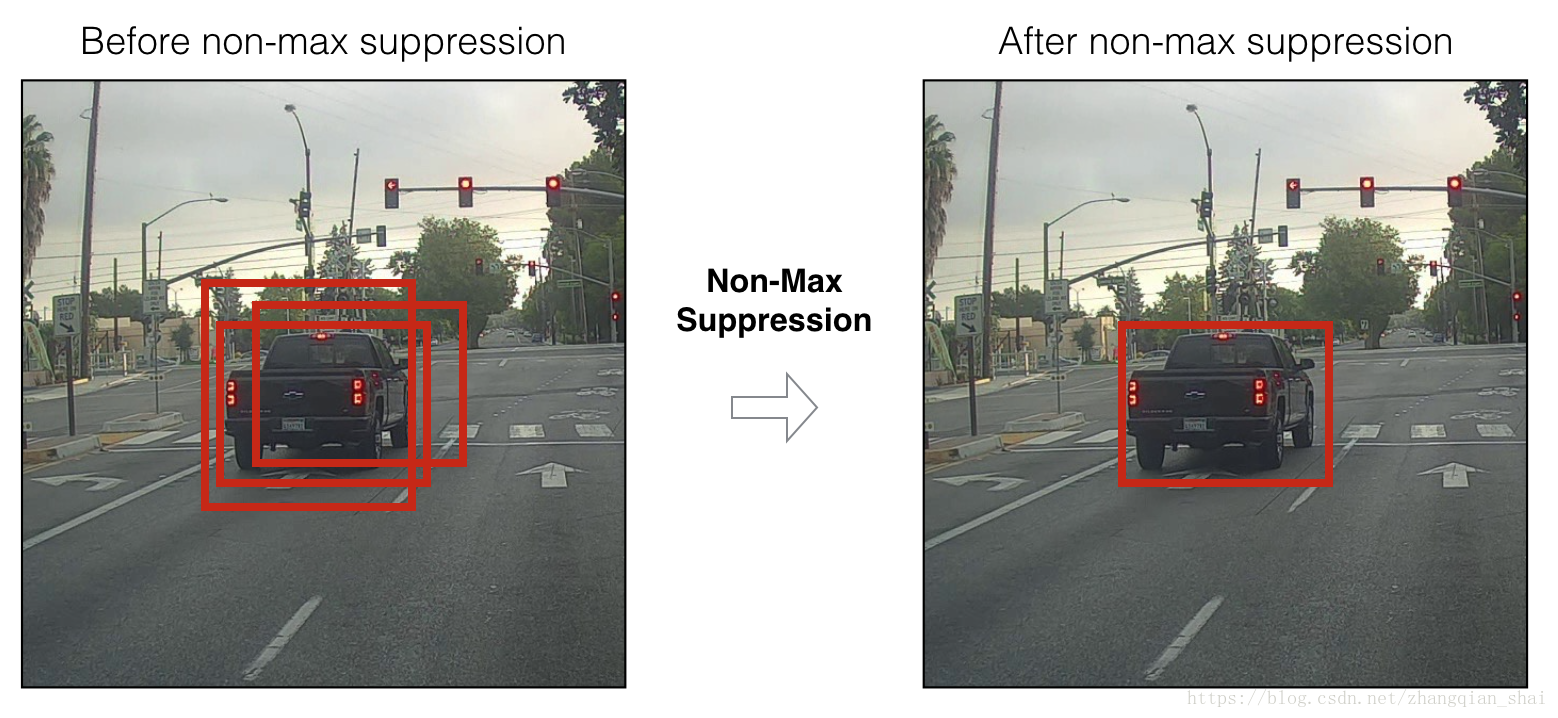
Figure 7 : In this example, the model has predicted 3 cars, but it’s actually 3 predictions of the same car. Running non-max suppression (NMS) will select only the most accurate (highest probabiliy) one of the 3 boxes.
非最大抑制使用了非常重要的函数,称为“Intersection over Union”or IoU.
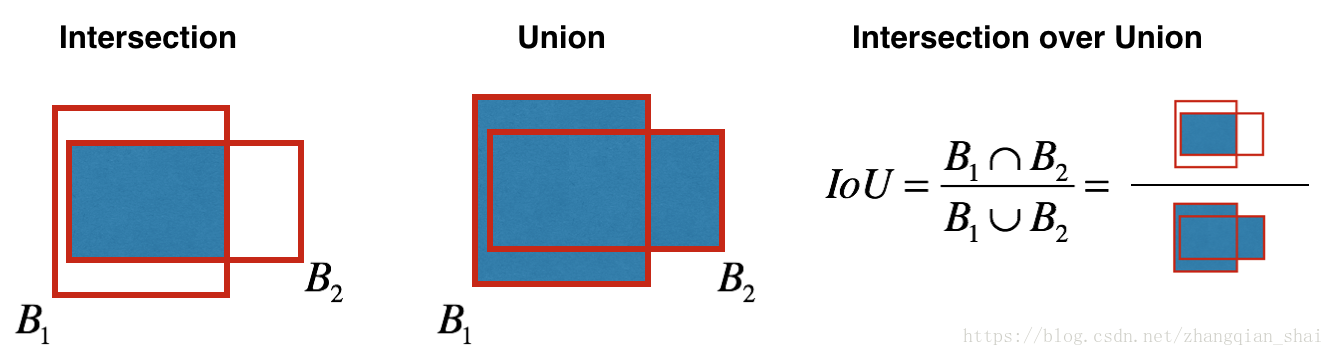
Figure 8 : Definition of “Intersection over Union”.
练习:实现 IoU(). 提示:
1.在这个练习中,我们用两个角(左上和右下)定义一个边框:(x_1, y_1, x_2, y_2), 而不是中点和高度/宽度。
2.计算矩形的面积,需要高(y_2 - y_1)*宽(x_2 - x_1)。
3.还需要找到两个框的交集的坐标(xi_1, yi_1, xi_2, yi_2)。
注意:
xi_1 =两个框的x1坐标的最大值。
yi_1 =两个框的y1坐标的最大值。
xi_2 =两个框的x2坐标的最大值。
yi_2 =两个框的y2坐标的最大值。
这里,我们使用的坐标是(0,0)在图片的左上角,(1,0)在图片的右上角,(1,1)在右下角。
# GRADED FUNCTION: ioudef iou(box1, box2):
"""Implement the intersection over union (IoU) between box1 and box2
Arguments:
box1 -- first box, list object with coordinates (x1, y1, x2, y2)
box2 -- second box, list object with coordinates (x1, y1, x2, y2)
"""
# Calculate the (y1, x1, y2, x2) coordinates of the intersection of box1 and box2. Calculate its Area.
### START CODE HERE ### (≈ 5 lines)
xi1 = np.max([box1[0], box2[0]])
yi1 = np.max([box1[1], box2[1]])
xi2 = np.min([box1[2], box2[2]])
yi2 = np.min([box1[3], box2[3]])
inter_area = max((yi2 - yi1), 0) * max((xi2 - xi1), 0)
### END CODE HERE ###
# Calculate the Union area by using Formula: Union(A,B) = A + B - Inter(A,B)
### START CODE HERE ### (≈ 3 lines)
box1_area = (box1[3]-box1[1]) *(box1[2]- box1[0])
box2_area = (box2[3]-box2[1]) *(box2[2]- box2[0])
union_area = box1_area + box2_area - inter_area
### END CODE HERE ###
# compute the IoU
### START CODE HERE ### (≈ 1 line)
iou = inter_area / union_area
### END CODE HERE ###
return iou运行验证
box1 = (2, 1, 4, 3)
box2 = (1, 2, 3, 4)
print("iou = " + str(iou(box1, box2)))
输出结果:
IoU =0.14285714285714285
现在准备实现非最大抑制,关键步骤如下:
1.选择分数(置信率)最高的边框
2.计算它与其他框的重叠(计算IOU),如果其值大于一定阈值(重合度过高),那么就将该框剔除;
3.返回第一步,重复上述过程,直到没有其他边框比当前边框得分更低。
这将删除与所选框有很大重叠的框,只留下“最好(分数最高)”的框。
练习:使用TensorFlow实现yolo_non_max_suppression()。TensorFlow有两个内置函数用于实现非最大抑制(所以实际上不需要使用iou()实现):
# GRADED FUNCTION: yolo_non_max_suppression
def yolo_non_max_suppression(scores, boxes, classes, max_boxes = 10, iou_threshold = 0.5):
    """
    Applies Non-max suppression (NMS) to set of boxes

    Arguments:
    scores -- tensor of shape (None,), output of yolo_filter_boxes()
    boxes -- tensor of shape (None, 4), output of yolo_filter_boxes() that have been scaled to the image size (see later)
    classes -- tensor of shape (None,), output of yolo_filter_boxes()
    max_boxes -- integer, maximum number of predicted boxes you'd like
    iou_threshold -- real value, "intersection over union" threshold used for NMS filtering

    Returns:
    scores -- tensor of shape (, None), predicted score for each box
    boxes -- tensor of shape (4, None), predicted box coordinates
    classes -- tensor of shape (, None), predicted class for each box

    Note: The "None" dimension of the output tensors has obviously to be less than max_boxes. Note also that this
    function will transpose the shapes of scores, boxes, classes. This is made for convenience.
    """

    max_boxes_tensor = K.variable(max_boxes, dtype='int32')     # tensor to be used in tf.image.non_max_suppression()
    K.get_session().run(tf.variables_initializer([max_boxes_tensor])) # initialize variable max_boxes_tensor

    # Use tf.image.non_max_suppression() to get the list of indices corresponding to boxes you keep
    ### START CODE HERE ### (≈ 1 line)
    #去除首先从所有的检测框中找到置信度较大的那个框,然后挨个计算其与剩余框的IOU,
    #如果其值大于一定阈值(重合度过高),那么就将该框剔除;
    #然后对剩余的检测框重复上述过程,直到处理完所有的检测框。
    nms_indices = tf.image.non_max_suppression(boxes, scores, max_boxes_tensor, iou_threshold)
    ### END CODE HERE ###

    # Use K.gather() to select only nms_indices from scores, boxes and classes
    ### START CODE HERE ### (≈ 3 lines)
    scores = K.gather(scores, nms_indices)
    boxes = K.gather(boxes, nms_indices)
    classes = K.gather(classes, nms_indices)
    ### END CODE HERE ###

    return scores, boxes, classes
2.4-Wrapping up the filtering
下面实现一个函数,该函数包含深度CNN(19x19x5x85维编码)的输出,并使用上述实现的函数过滤所有的框。
练习:实现yolo_eval( ) ,该函数实现YOLO编码的输出,并使用置信率阈值和非最大抑制滤除其他边框。还要注意最后一个细节,边框有几种表示方法,比如通过角或者通过中点和高度/宽度。不同时间YOLO会在几种格式之间转换,以下函数可以实现格式转换功能:
boxes = yolo_boxes_to_corners(box_xy, box_wh)该代码实现YOLO边框坐标(x, y, w, h)转换为边框角坐标(x1, y1, x2, y2),以适应函数yolo_filter_boxes的输入。
boxes = scale_boxes(boxes, image_shape)YOLO网络训练后运行在608x608的图片上。如果你在不同大小的图片上测试数据——比如车辆检测集图片维度是720x1280——该步骤会重新调整边框,以便将边框绘制在720x1280大小图像上。
def yolo_eval(yolo_outputs, image_shape = (720., 1280.), max_boxes=10, score_threshold=.6, iou_threshold=.5):
    """
    Converts the output of YOLO encoding (a lot of boxes) to your predicted boxes along with their scores, box coordinates and classes.

    Arguments:
    yolo_outputs -- output of the encoding model (for image_shape of (608, 608, 3)), contains 4 tensors:
                    box_confidence: tensor of shape (None, 19, 19, 5, 1)
                    box_xy: tensor of shape (None, 19, 19, 5, 2)
                    box_wh: tensor of shape (None, 19, 19, 5, 2)
                    box_class_probs: tensor of shape (None, 19, 19, 5, 80)
    image_shape -- tensor of shape (2,) containing the input shape, in this notebook we use (608., 608.) (has to be float32 dtype)
    max_boxes -- integer, maximum number of predicted boxes you'd like
    score_threshold -- real value, if [ highest class probability score < threshold], then get rid of the corresponding box
    iou_threshold -- real value, "intersection over union" threshold used for NMS filtering

    Returns:
    scores -- tensor of shape (None, ), predicted score for each box
    boxes -- tensor of shape (None, 4), predicted box coordinates
    classes -- tensor of shape (None,), predicted class for each box
    """

    ### START CODE HERE ###

    # Retrieve outputs of the YOLO model (≈1 line)
    box_confidence, box_xy, box_wh, box_class_probs = yolo_outputs

    # Convert boxes to be ready for filtering functions
    boxes = yolo_boxes_to_corners(box_xy, box_wh)

    # Use one of the functions you've implemented to perform Score-filtering with a threshold of score_threshold (≈1 line)
    scores, boxes, classes = yolo_filter_boxes(box_confidence, boxes, box_class_probs)

    # Scale boxes back to original image shape.
    boxes = scale_boxes(boxes, image_shape)

    # Use one of the functions you've implemented to perform Non-max suppression with a threshold of iou_threshold (≈1 line)
    scores, boxes, classes = yolo_non_max_suppression(scores, boxes, classes)

    ### END CODE HERE ###

    return scores, boxes, classes
YOLO总结:
1.输入图片(608,608,3)
2.输入图片经过CNN处理,结果输出(19,19,5,85)维;
3.将最后两个维度压平后,输出的体积维度是(19,19,425):
a.输入图像的19x19网格中,每个单元格都有425个数字。
b.425=5x85,因为每个单元格包含5个框的预测,对应5个锚点框,如上文所示。
c.85=5+80,其中5是因为(p_c, b_x, b_y, b_h, b_w)有5个数字,80是将要预测的分类数。
4.然后根据以下内容选择几个框:
a.置信率阈值:丢弃那些置信率低于检测类的阈值的边框。
b.非最大抑制:计算IOU,避免选择重叠的边框。
5.给出YOLO最终的输出。
3-Test YOLO pretrained model on images
该部分,将使用一个预训练过的模型,并在车辆检测数据集上进行测试。一般,首先创建一个会话来启动图表,运行下面代码:
sess = K.get_session()3.1-Defining classes, anchors and image shape
再次强调,我们将检测80个分类,并使用5组边框。我们在两个文件夹“coco_classes.txt” 和 “yolo_anchors.txt”中得到关于80个类和5个边框的信息。通过运行下面代码,将这些参量加载到模型中。
汽车检测数据集有720x1280张图像,我们将图像预处理成608x608的图像。
class_names = read_classes("model_data/coco_classes.txt")
anchors = read_anchors("model_data/yolo_anchors.txt")
image_shape = (720., 1280.)
3.2-Loading a pretrained model
训练一个模型需要很长时间,并需要一个相当大的标签边框数据集,用于范围的目标类。这里将加载存储在“yolo.h5”中的现有预训练的Keras YOLO模型。运行下面代码,从这个文件加载模型。
yolo_model = load_model("model_data/yolo.h5")这就加载了训练好的YOLO模型的权重参数。
注意:该模型将预处理的一批输入图像(形状:(m,608,608,3)转换为形状张量(m,19,19,5,85)),如图2所示。
3.3-Convert output of the model to usable bounding box tensors
yolo_model的输出是一个(m、19、19、5、85)张量,需要通过非线性的处理和转换。通过以下代码实现。
yolo_outputs = yolo_head(yolo_model.output, anchors, len(class_names))将yolo_output添加到图中,这4个张量的集合将作为yolo_eval函数的输入。
3.4-Filtering boxes
yolo_outputs以正确的格式提供了yolo_model的所有预测框。 现在准备好执行过滤并仅选择最佳框。 下面调用之前实现的yolo_eval来做到这一点。
scores, boxes, classes = yolo_eval(yolo_outputs, image_shape)3.5-Run the graph on an image
下面开始,你已经创建了一个(sess)图,可以总结如下:
1.yolo_model.input被赋予yolo_model,该模型用于计算输出yolo_model.output;
2.yolo_model.output由yolo_head进行处理, 输出yolo_outputs;
3.yolo_output通过一个过滤函数yolo_eval进行处理,输出预测值:置信率(scores),边框(boxes),分类(classes).
练习:实现expect(),运行图形在图像上测试YOLO,这里需要运行TensorFlow会话,来计算置信率(scores),边框(boxes),分类(classes).
下面的代码还是使用了以下函数:
image, image_data = preprocess_image("images/" + image_file, model_image_size = (608, 608))输出:
1.image:用于绘制边框的图像的python表示。不需要使用。
2.image_data: 表示图像的numpy-array,这将是CNN的输入。
注意:当一个模型使用BatchNorm(就像YOLO一样时),你需要在feed_dict{K.learning_phase(): 0}中传递一个额外的占位符。
def predict(sess, image_file):
    """
    Runs the graph stored in "sess" to predict boxes for "image_file". Prints and plots the preditions.

    Arguments:
    sess -- your tensorflow/Keras session containing the YOLO graph
    image_file -- name of an image stored in the "images" folder.

    Returns:
    out_scores -- tensor of shape (None, ), scores of the predicted boxes
    out_boxes -- tensor of shape (None, 4), coordinates of the predicted boxes
    out_classes -- tensor of shape (None, ), class index of the predicted boxes

    Note: "None" actually represents the number of predicted boxes, it varies between 0 and max_boxes.
    """

    # Preprocess your image
    image, image_data = preprocess_image("images/" + image_file, model_image_size = (608, 608))

    # Run the session with the correct tensors and choose the correct placeholders in the feed_dict.
    # You'll need to use feed_dict={yolo_model.input: ... , K.learning_phase(): 0})
    ### START CODE HERE ### (≈ 1 line)
    out_scores, out_boxes, out_classes = sess.run([scores, boxes, classes], feed_dict={yolo_model.input: image_data, K.learning_phase(): 0})
    ### END CODE HERE ###

    # Print predictions info
    print('Found {} boxes for {}'.format(len(out_boxes), image_file))
    # Generate colors for drawing bounding boxes.
    colors = generate_colors(class_names)
    # Draw bounding boxes on the image file
    draw_boxes(image, out_scores, out_boxes, out_classes, class_names, colors)
    # Save the predicted bounding box on the image
    image.save(os.path.join("out", image_file), quality=90)
    # Display the results in the notebook
    output_image = scipy.misc.imread(os.path.join("out", image_file))
    imshow(output_image)

    return out_scores, out_boxes, out_classes
在”test.jpg”图片上运行以下代码,验证你函数是否正确。
out_scores, out_boxes, out_classes = predict(sess, "test.jpg")#输出
Found 7 boxes for test.jpg
car 0.60 (925, 285) (1045, 374)
car 0.66 (706, 279) (786, 350)
bus 0.67 (5, 266) (220, 407)
car 0.70 (947, 324) (1280, 705)
car 0.74 (159, 303) (346, 440)
car 0.80 (761, 282) (942, 412)
car 0.89 (367, 300) (745, 648)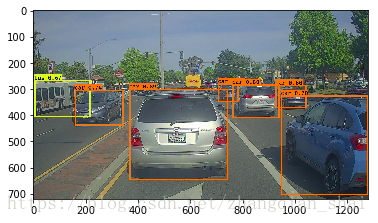
刚刚运行的模型实际能够检测出“coco_classes.txt”中列出的80个不同的类。
要点:
1.YOLO是最先进的物体检测模型,它快速准确。
2.它通过CNN运行一个输入图像,输出19x19x5x85 维体积。
3.编码可以看作是一个网格,其中19x19单元格中的每个单元格包含有关5个框的信息。
4.使用非最大抑制过滤所有边框,具体如下:
a.对检测类的概率进行阈值处理,以仅保留准确率高的框;
b.联合交集(IoU)阈值消除重叠框。
5.从随机初始化的权重训练一个YOLO模型是非常重要的,需要大量的数据集和大量的计算资源,所以我们在这个练习中使用了预训练的模型参数。你也可以尝试用自己的数据集对YOLO模型进行微调。