微服务(Microservices Architecture)是一种架构风格,一个大型复杂软件应用由一个或多个微服务组成。系统中的各个微服务可被独立部署,各个微服务之间是松耦合的。每个微服务仅关注于完成一件任务并很好地完成该任务。在所有情况下,每个任务代表着一个小的业务能力。Spring Cloud是一个基于Spring Boot实现的云应用开发工具,它为基于JVM的云应用开发中涉及的配置管理、服务发现、断路器、智能路由、微代理、控制总线、全局锁、决策竞选、分布式会话和集群状态管理等操作提供了一种简单的开发方式。
这里我们将叙述Spring Cloud中的断路器监控Hystrix Dashboard,在此之前我们需要了解一下Spring Cloud的基本组件。详情可了解https://www.souyunku.com/categories/。
Hystrix Dashboard在微服务架构中为例保证程序的可用性,防止程序出错导致网络阻塞,出现了断路器模型。断路器的状况反应了一个程序的可用性和健壮性,它是一个重要指标。Hystrix Dashboard是作为断路器状态的一个组件,提供了数据监控和友好的图形化界面。
准备项目:
1. eureka-service:eureka注册中心,端口:8761,用于服务注册与发现;
2. eureka-provider_1:服务提供者1,端口:8071,用于提供服务;
3. eureka-provider_2:服务提供者2,端口:8072,用于提供服务;
4. ribbon-consumer-hystrix-dashboard:带有断路器、监控面板的消费者,端口:9000,用于消费服务、提供断路器和监控界面。
1-3个项目可参考https://www.souyunku.com/自行创建,或者从下文附件中下载。我们详细讲下ribbon-consumer-hystrix-dashboard项目的构建;
ribbon-consumer-hystrix-dashboard :
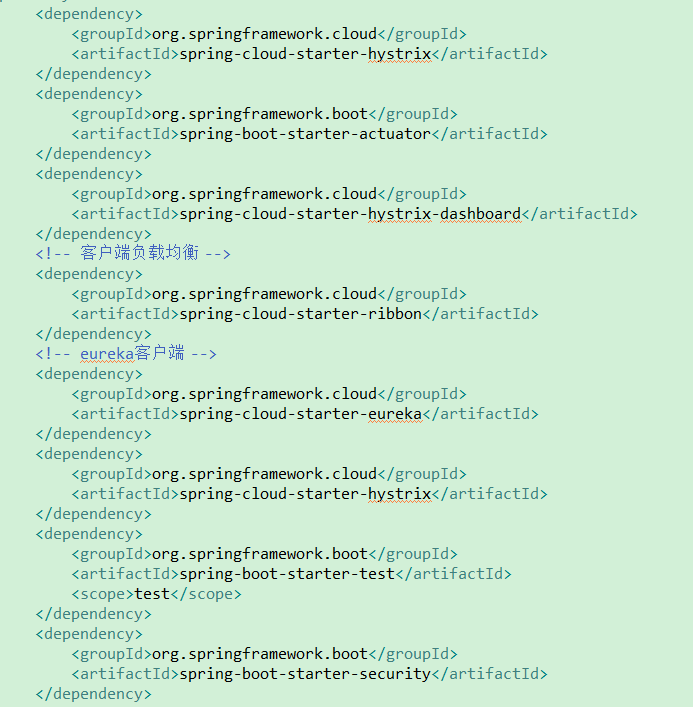
1.添加pom依赖:
2.启动类:
 1 /*
 2  * 开启服务负载均衡
 3  *
 4  * @EnableDiscoveryClient向服务注册中心注册
 5  * 并且向程序的ioc注入一个bean: restTemplate
 6  * 并通过@LoadBalanced注解表明这个restRemplate开启负载均衡的功能。
 7  */
 8 //通过 @EnableHystrix 开启 Hystrix 断路器监控,这个是必须的,并且需要在程序中声明断路点@HystrixCommand
 9 //加上@EnableHystrixDashboard注解,开启HystrixDashboard
10 @EnableHystrixDashboard
11 @EnableHystrix
12 @EnableDiscoveryClient
13 @SpringBootApplication
14 public class RibbonConsumerApplication_2 {
15
16     @LoadBalanced
17     @Bean
18     RestTemplate restTemplate() {
19         return new RestTemplate();
20     }
21
22
23     public static void main(String[] args) {
24
25         SpringApplication.run(RibbonConsumerApplication_2.class, args);
26         //将存放该项目注册信息的接口url写入本地文件
27     }
28
29 }
3. 控制层:
 1 /**
 2  * 消费提供者方法
 3  * 描述:调用提供者的 `home` 方法
 4  **/
 5 @RestController
 6 public class ConsumerController {
 7
 8     @Autowired
 9     private RestTemplate restTemplate;
10
11     //创建了熔断器的功能 ,并指定了defaultStores熔断方法
12     //@HystrixCommand 声明短路点,表明该方法为hystrix包裹,
13     //可以对依赖服务进行隔离、降级、快速失败、快速重试等等hystrix相关功能
14     //fallbackMethod 降级方法
15     //commandProperties 普通配置属性,可以配置HystrixCommand对应属性,例如采用线程池还是信号量隔离、熔断器熔断规则等等
16     //ignoreExceptions 忽略的异常,默认HystrixBadRequestException不计入失败
17     //groupKey() 组名称,默认使用类名称
18     //commandKey 命令名称,默认使用方法名
19     @HystrixCommand(fallbackMethod = "defaultStores")
20     @GetMapping(value = "/hello")
21     public String hello() {
22         return restTemplate.getForEntity("http://eureka-provider/", String.class).getBody();
23     }
24
25     //熔断方法直接返回了一个字符串, "feign + hystrix ,提供者服务挂了"
26     public String defaultStores() {
27         return "Ribbon + hystrix ,提供者服务挂了";
28     }
29 }
4. 安全控制 ,访问/hystrix路径要进行登录认证(可以不设置)
 1 @Configuration
 2 //@EnableWebSecurity
 3 public class SecurityConfiguration extends WebSecurityConfigurerAdapter{
 4
 5     @Override
 6     protected void configure(final HttpSecurity http) throws Exception {
 7         http.httpBasic()
 8             .and()
 9             .authorizeRequests()
10             .antMatchers("/hystrix")
11             .authenticated();
12     }
13
14     @Autowired
15     public void configureGlobal(AuthenticationManagerBuilder auth) throws Exception {
16         auth
17             .inMemoryAuthentication()
18                 .withUser("root").password("123").roles("USER");//设置用户名密码
19     }
20
21 }
启动步骤:
1.启动注册中心 :eureka-service
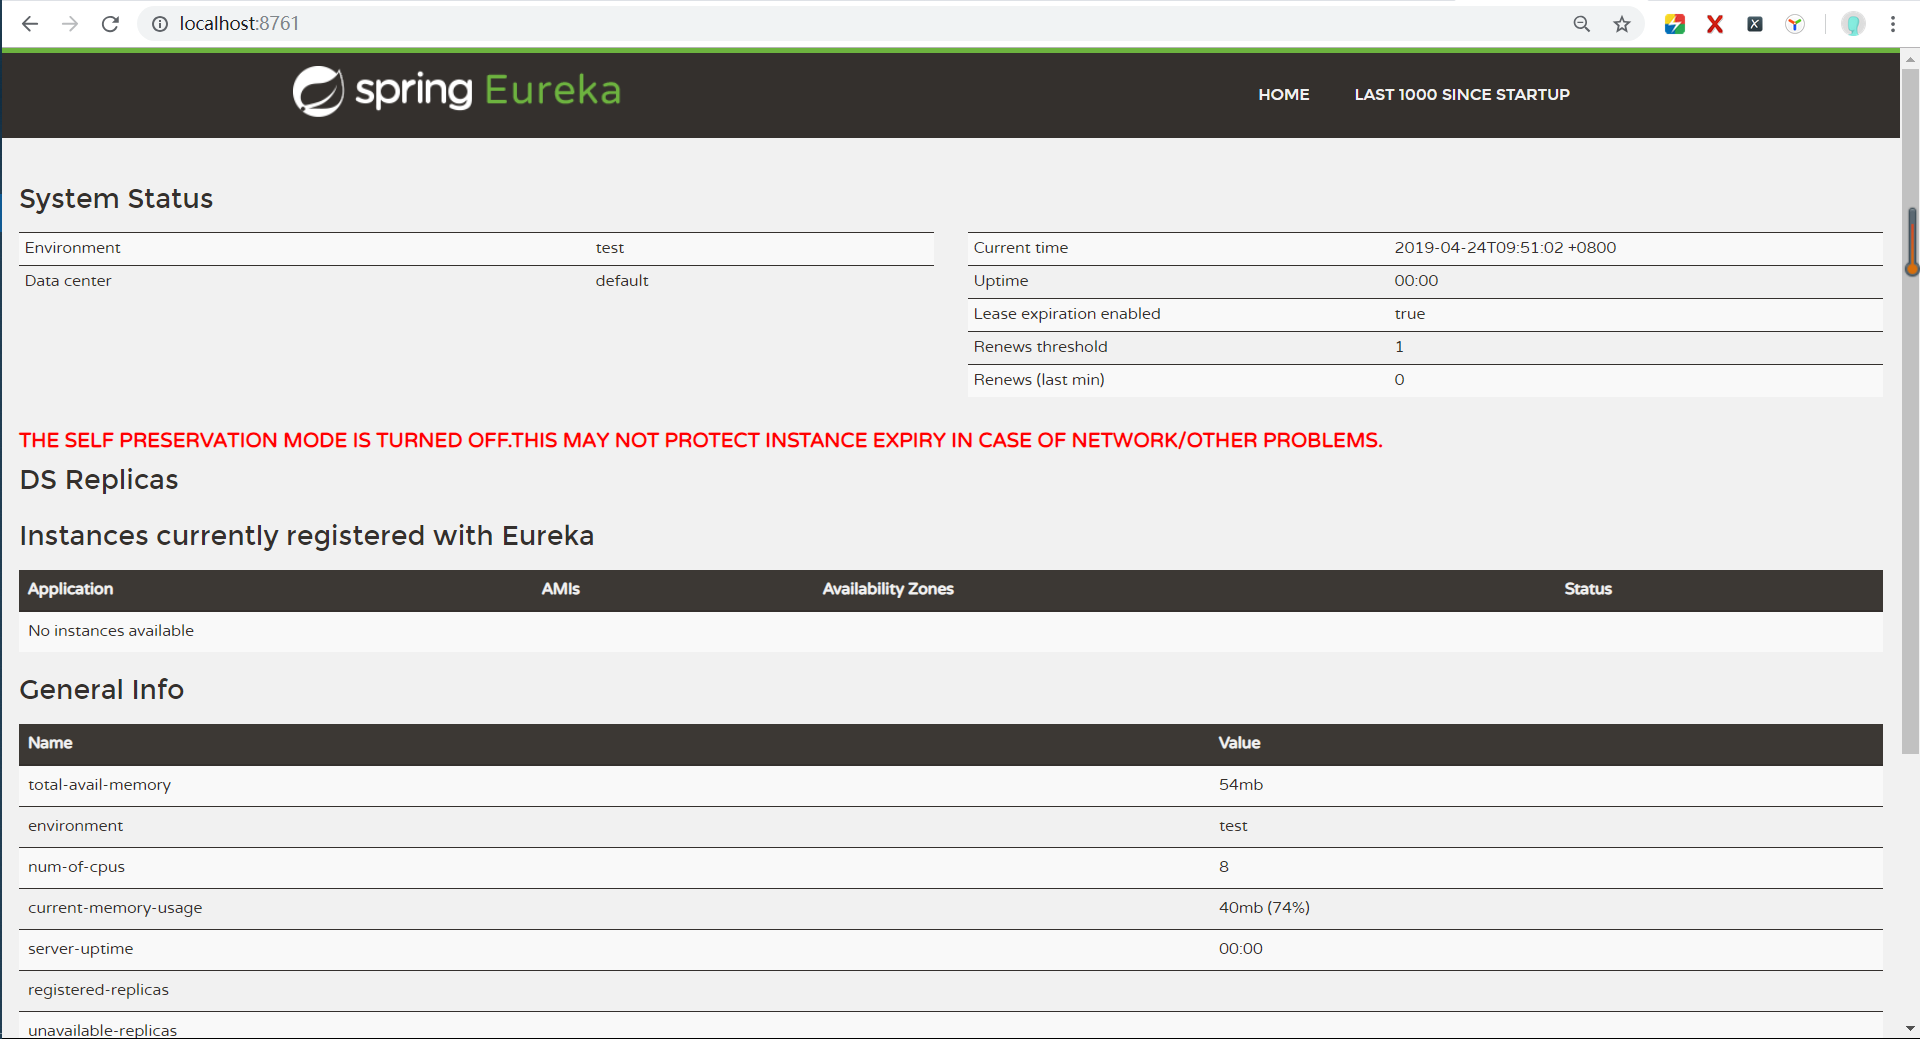
2.启动eureka-provider_1和eureka-provider_2,启动后注册中心监控面板显示服务以及注册到eureka:

3.启动消费者项目:ribbon-consumer-hystrix-dashboard,启动后可在eureka注册中心发现服务
4. 登录断路器监控面板
由于我们添加了登录认证,需要在弹出框输入用户名密码(已在代码中配置)

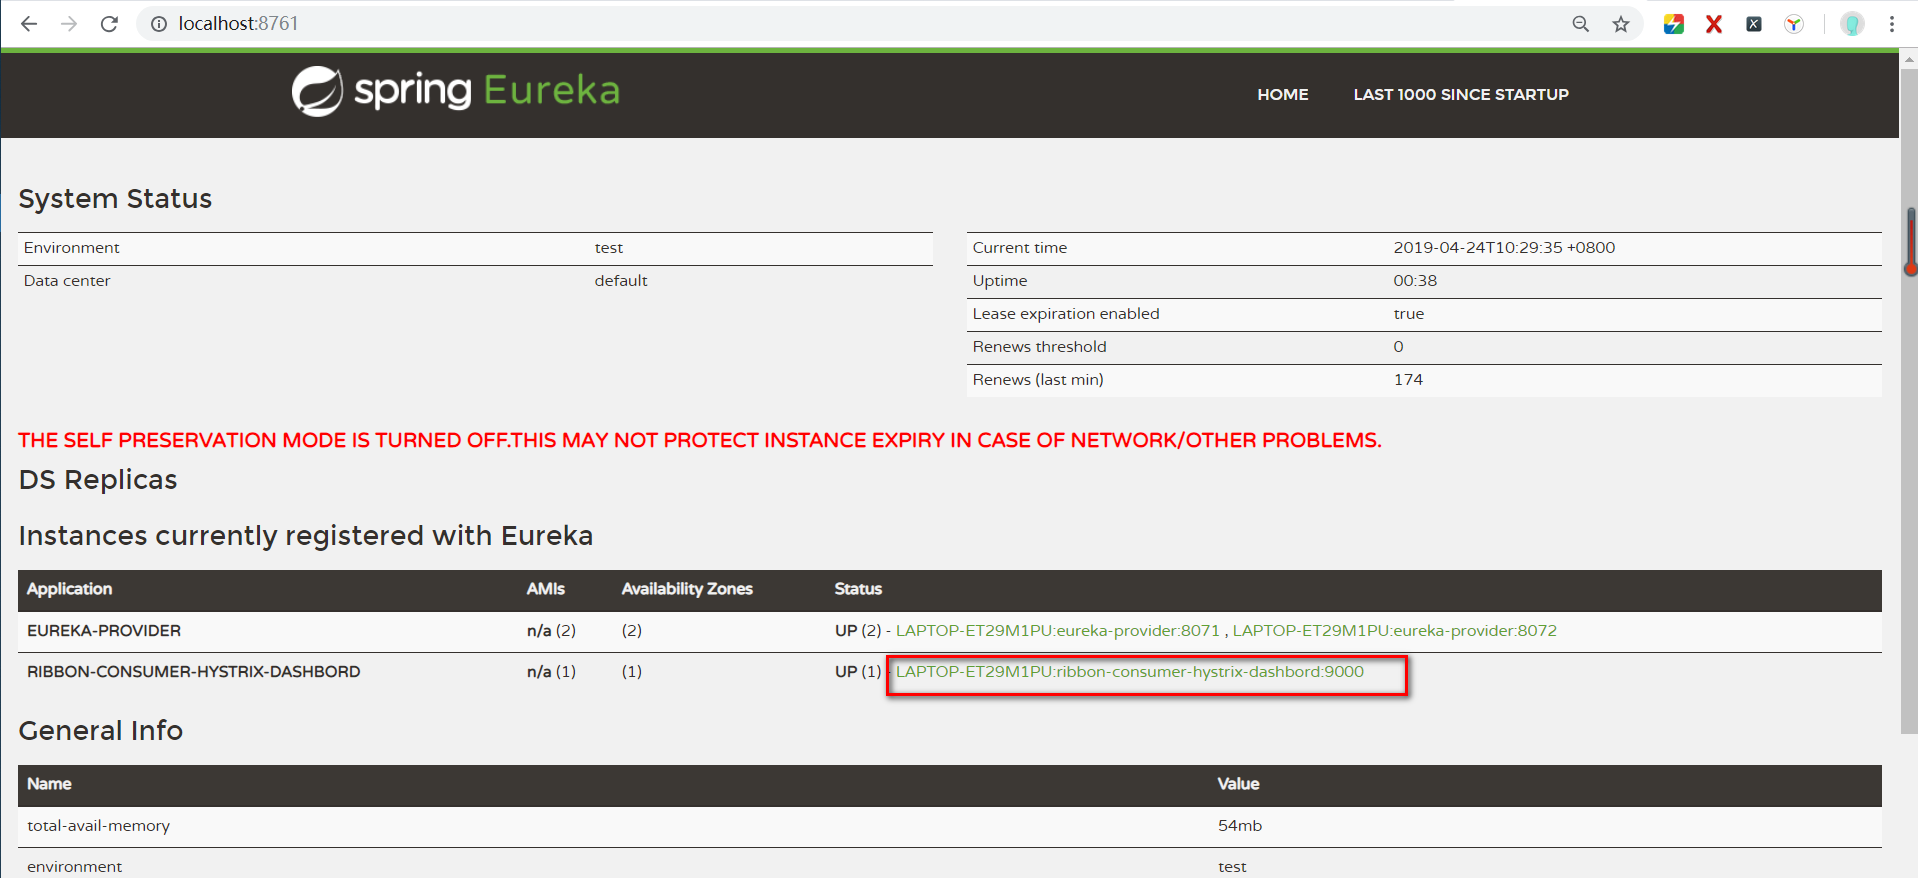
登录后监控面板主页:看见一只像刺猬的神情有点凶小熊就可以了

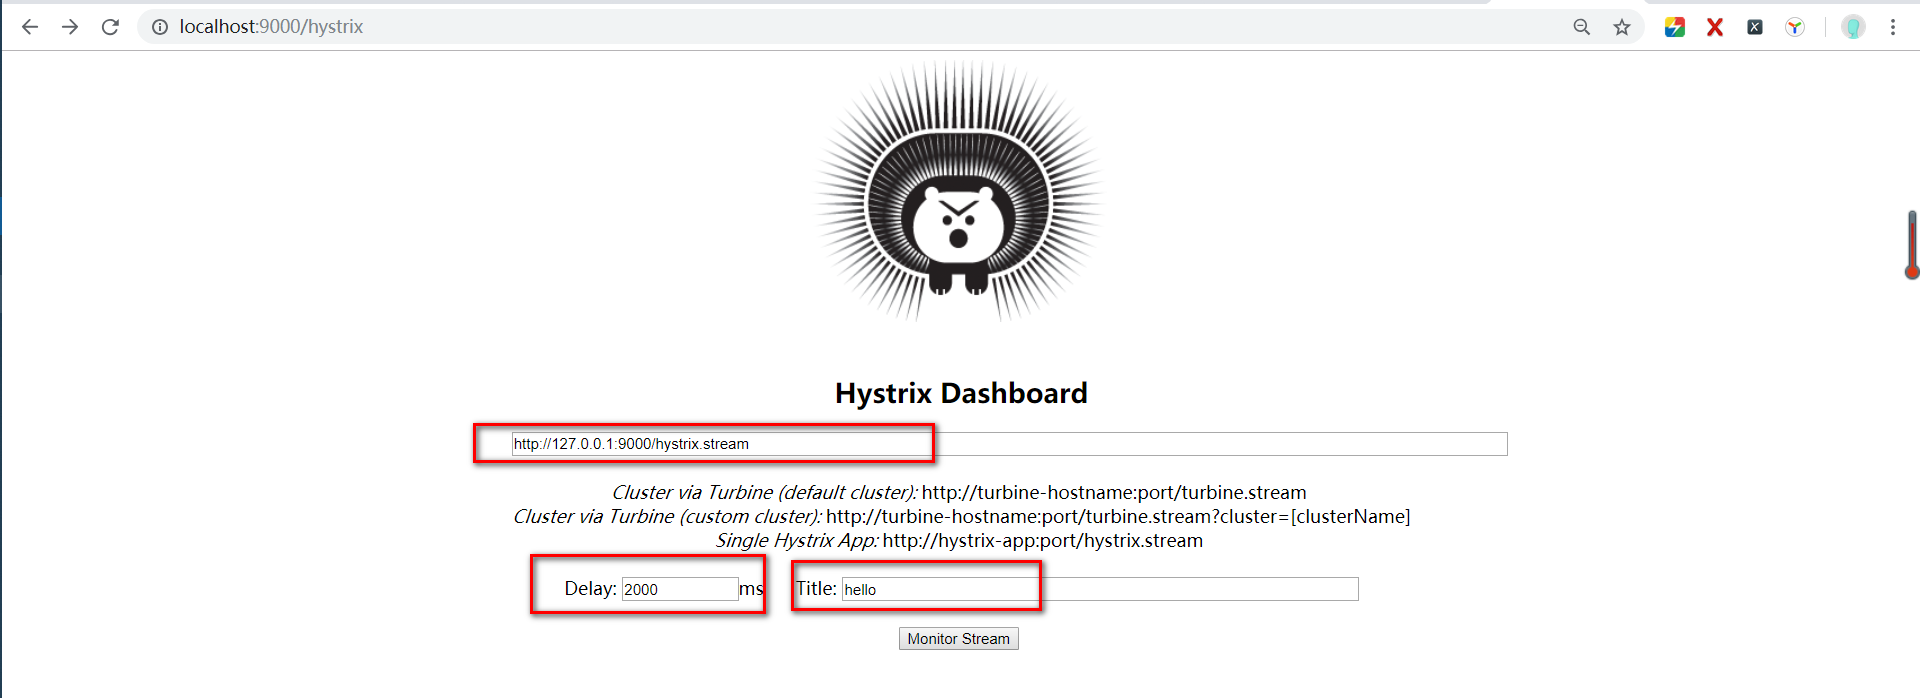
5.进入图形化监控页面:
在界面依次输入:
http://127.0.0.1:9000/hystrix.stream (需要监控的)
2000 (获取监控数据间隔时间)
hello (需要监控的接口)

我们可以看一下http://127.0.0.1:9000/hystrix.stream,可以看见图形化界面的显示就是根据项目暴露的hystrix.stream接口返回的数据进行监听的。

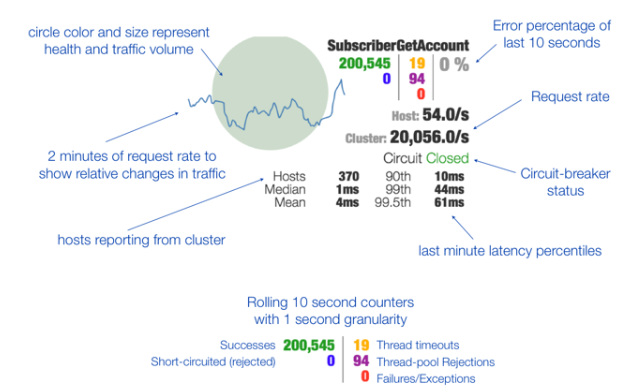
下图是网上找的显示各指标的含义:
最后附上这四个项目的百度网盘地址:
链接:https://pan.baidu.com/s/1Q1R9I7IkQJ78sJUaokD04A
提取码:b37z