VOC数据格式可视化
import numpy as np
import xml.etree.ElementTree as ET
import os
import cv2
import matplotlib.pyplot as plt
#import sys
#reload(sys)
#sys.setdefaultencoding("utf-8")
def GetFileFromThisRootDir(dir,ext = None):
allfiles = []
needExtFilter = (ext != None)
for root,dirs,files in os.walk(dir): #files是文件夹下所有文件的名称
for filespath in files: #依次取文件名
filepath = os.path.join(root, filespath) #构成绝对路径
extension = os.path.splitext(filepath)[1][1:] #os.path.splitext(path) #分割路径,返回路径名和文件后缀 其中[1]为后缀.png,再取[1:]得到png
if needExtFilter and extension in ext:
allfiles.append(filepath)
elif not needExtFilter:
allfiles.append(filepath)
return allfiles #返回dir中所有文件的绝对路径
def custombasename(fullname):
#os.path.basename返回路径的最后一个部分,也就是文件名(os.path.splitext(fullname)[0]是除掉后缀的路径)
return os.path.basename(os.path.splitext(fullname)[0])
def load_pascal_annotation(xmlpath):
nameboxdict = {}
gtAttribute = [] #用于进行gt的属性统计
for index, xmlname in enumerate(xmlpath):
dets = []
picname = custombasename(xmlname)
tree = ET.parse(xmlname)
objs = tree.findall('object')
# Load object bounding boxes into a data frame.
for ix, obj in enumerate(objs): # 对于该图片上每一个object
det = []
name = obj.find('name') # 找到XML文件中给用于存放gt坐标的<name>模块
#gt_classes.append(name.text)
bbox = obj.find('bndbox') # 找到XML文件中给用于存放gt坐标的<bndbox>模块
x1 = float(bbox.find('xmin').text) #左上角列
y1 = float(bbox.find('ymin').text) #左上角行
x2 = float(bbox.find('xmax').text) #右下角列
y2 = float(bbox.find('ymax').text) #右下角行
width = x2 - x1 #宽
if width == 0:
raise IOError(('width = 0,图片路径为{:s}').format(xmlpath))
#print('width = 0,图片路径为%s'%xmlpath)
continue
else:
height = y2 - y1 #高
area = float(width * height) #面积
scale = float(height/width) #高比宽
gtdet = [name.text, width, height, area, scale]
gtAttribute.append(gtdet)
det = [name.text, x1, y1, x2, y2]
dets.append(det)
if (picname not in nameboxdict):
nameboxdict[picname] = []
nameboxdict[picname].append(dets)
return nameboxdict,gtAttribute
def write_txt(nameboxdict,txtdir):
'''
将读取的gt写入txt
'''
if not os.path.exists(txtdir):
os.makedirs(txtdir)
for key in nameboxdict: #key是每一个xlm的名字
dets = nameboxdict[key][0] #取相应名字的dets(dets包括该xml所有ob和box)
gt_txtdir = os.path.join(txtdir, key +'.txt') #生成相应名字的txt文件,用以写gt
with open(gt_txtdir, 'wt') as f_out:
for i in range(len(dets)):
det = dets[i]
f_out.write('{:s},{:.1f},{:.1f},{:.1f},{:.1f}\n'.format(det[0],
det[1] + 1, det[2] + 1,
det[3] + 1, det[4] + 1))
def GtVisualise(nameboxdict, JPEGpath, savepath):
'''
可视化gt
'''
if not os.path.exists(savepath):
os.makedirs(savepath)
font = cv2.FONT_HERSHEY_SIMPLEX
for idx,key in enumerate(nameboxdict): #key是每一个xlm的名字
dets = nameboxdict[key][0] #取相应名字的dets(dets包括该xml所有ob和box)
imagepath = os.path.join(JPEGpath, key+'.jpg')
img = cv2.imread(imagepath)
for i in range(len(dets)):
det = dets[i]
obname = str(det[0]) #类别名
left_up_col = int(np.round(det[1])) #先列后行
left_up_row = int(np.round(det[2]))
right_bottom_col = int(np.round(det[3]))
right_bottom_row = int(np.round(det[4]))
cv2.rectangle(img, (left_up_col, left_up_row), (right_bottom_col,right_bottom_row ), (0, 0, 255), thickness=1)
cv2.rectangle(img, (left_up_col, left_up_row-15), (left_up_col+65 ,left_up_row-2), (255, 0, 0), thickness=-1) #蓝色填充
cv2.putText(img, obname, (left_up_col, left_up_row-2), font, 0.5,(255, 255, 255), 1) #0.5是大小
cv2.imwrite(os.path.join(savepath, key + '.jpg'),img)
#print ('已完成第%d张'%(idx+1))
return (idx+1) #返回可视化的图片个数
def Attribute_statistics(gtAttribute):
gtAttribute = np.array(gtAttribute)
Object = gtAttribute[:,0]
Objectclass = np.unique(Object)
for j in range(len(Objectclass)):
Objectnum = (Object == Objectclass[j])
ObjectAttribute = gtAttribute[Objectnum]
Width = ObjectAttribute[:,1].astype(np.float32)
Width.sort()
Height = ObjectAttribute[:,2].astype(np.float32)
Height.sort()
Area = ObjectAttribute[:,3].astype(np.float32)
Area.sort()
Scale = ObjectAttribute[:,4].astype(np.float32)
Scale.sort()
fig = plt.figure()
ax1 = fig.add_subplot(221)
ax1.hist(Width,20)
ax1.set_title('Width')
ax2 = fig.add_subplot(222)
ax2.hist(Height,20)
ax2.set_title('Height')
ax3 = fig.add_subplot(223)
ax3.hist(Area,20)
ax3.set_title('Area')
ax4 = fig.add_subplot(224)
ax4.hist(Scale,20)
ax4.set_title('Scale')
fig.suptitle(Objectclass[j]) #大图
plt.show()
if __name__ == '__main__':
xmldir = 'H:\\data\\sewage\\xml'
JPEGpath = 'H:\\data\\sewage\\images'
gtSavepath = 'H:\\faster_rcnn_for_hangtian\\data\\datasets\\hbbshow'
xmlpath = GetFileFromThisRootDir(xmldir)
nameboxdict, gtAttribute = load_pascal_annotation(xmlpath)
#Attribute_statistics(gtAttribute) #统计gt的属性
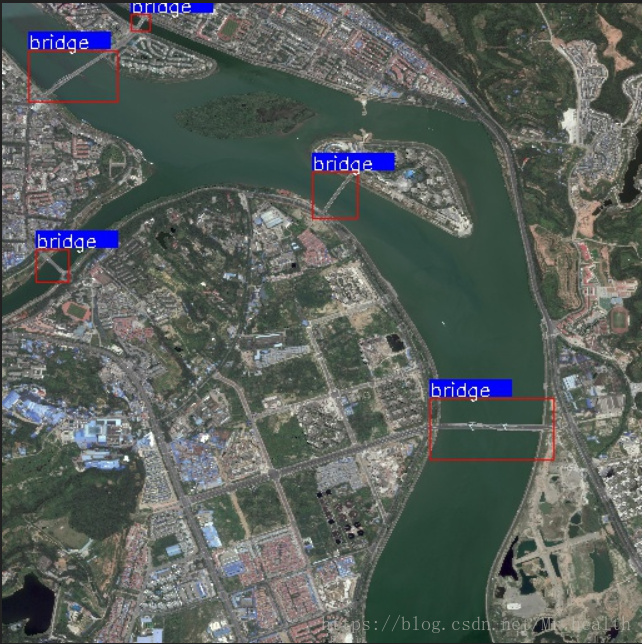
num = GtVisualise(nameboxdict, JPEGpath, gtSavepath)可视化结果:
DOTA数据格式可视化
import cv2
import os
import numpy as np


thr=0.95
def custombasename(fullname):
    return os.path.basename(os.path.splitext(fullname)[0])

def GetFileFromThisRootDir(dir,ext = None):
  allfiles = []
  needExtFilter = (ext != None)
  for root,dirs,files in os.walk(dir):
    for filespath in files:
      filepath = os.path.join(root, filespath)
      extension = os.path.splitext(filepath)[1][1:]
      if needExtFilter and extension in ext:
        allfiles.append(filepath)
      elif not needExtFilter:
        allfiles.append(filepath)
  return allfiles

def visualise_gt(label_path, pic_path, newpic_path):
    results =  GetFileFromThisRootDir(label_path)
    for result in results:
        f = open(result,'r')
        lines = f.readlines()
        boxes = []
        for line in lines:
            #score = float(line.strip().split(' ')[8])
            name = result.split('/')[-1]
            box=line.strip().split(' ')[0:8]
            box = np.array(box,dtype = np.float)
            #if float(score)>thr:
            boxes.append(box)
        boxes = np.array(boxes,np.float)
        f.close()
        filepath=os.path.join(pic_path, name.split('.')[0]+'.jpg')
        im=cv2.imread(filepath)
        #print line3
        for i in range(boxes.shape[0]):
            box =np.array( [[boxes[i][0],boxes[i][1]],[boxes[i][2],boxes[i][3]], \
                            [boxes[i][4],boxes[i][5]],[boxes[i][6],boxes[i][7]]],np.int32)
            box = box.reshape((-1,1,2))
            cv2.polylines(im,[box],True,(0,255,255),2)
        cv2.imwrite(os.path.join(newpic_path,result.split('/')[-1].split('.')[0]+'.jpg'),im)
        #下面是有score的
        #        x,y,w,h,score=box.split('_')#
        #        score=float(score)
        #        cv2.rectangle(im,(int(x),int(y)),(int(x)+int(w),int(y)+int(h)),(0,0,255),1)
        #        cv2.putText(im,'%3f'%score, (int(x)+int(w),int(y)+int(h)+5),cv2.FONT_HERSHEY_SIMPLEX,0.5,(0,255,0),1)
        #        cv2.imwrite(newpic_path+filename,im)

if __name__ == '__main__':
    root='/home/yantianwang/clone/Hangtian/Orgdata/aug'
    pic_path = os.path.join(root, 'new_JPEGImages') #样本图片路径
    label_path = os.path.join(root, 'new_labelTxt') #DOTA标签的所在路径
    newpic_path=os.path.join(root,'hbbshow')
    visualise_gt(label_path, pic_path, newpic_path)