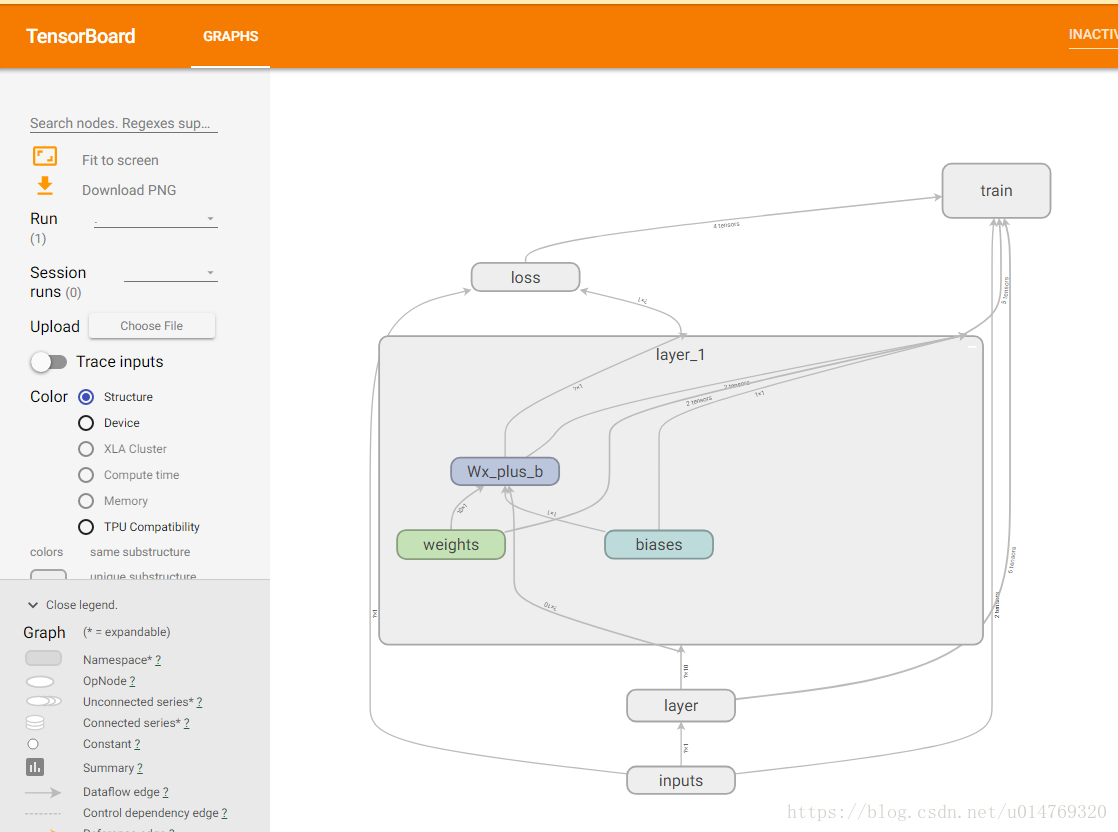
最近两天在跟着莫烦大神修炼TensorFlow,今天学到的是TensorFlow 可视化,是Tensorboard下显示的。现附上莫烦大神的代码,和本机运行的可视化结果和操作。
学习视频:Tensorflow 搭建自己的神经网络 (莫烦 Python 教程) https://www.bilibili.com/video/av16001891
系统环境:
- Win7 64位
- pycharm
- python 3.6
- Anaconda3(64-bit)
代码如下:(代码来源,跟着视频敲的,有些自己的注释)
# @Author : cyl
# @Time : 2018/8/9 10:07

import os
os.environ['TF_CPP_MIN_LOG_LEVEL'] = '2'
import tensorflow as tf
import numpy as np

def add_layer(inputs,in_size,out_size,activation_function=None):
    '''
    添加隐藏层
    :param inputs:
    :param in_size:
    :param out_size:
    :param activation_function:激活函数
    :return:
    '''
    with tf.name_scope('layer'):
        with tf.name_scope('weights'):
            Weights=tf.Variable(tf.random_normal([in_size,out_size]),name='weight')  # 定义为一个矩阵
        with tf.name_scope('biases'):
          biases = tf.Variable(tf.zeros([1,out_size])+0.1)
        with tf.name_scope('Wx_plus_b'):
            Wx_plus_b = tf.add(tf.matmul(inputs,Weights),biases) # 存储预测的值
        if activation_function is None:
            outputs = Wx_plus_b
        else:
            outputs = activation_function(Wx_plus_b)

        return outputs
# 定义数据
x_data = np.linspace(-1,1,300)[:,np.newaxis]
noise = np.random.normal(0,0.05,x_data.shape)  # 生成噪声数据
y_data = np.square(x_data)-0.5+noise

with tf.name_scope('inputs'):
    xs = tf.placeholder(tf.float32,[None,1],name="x_input")
    ys = tf.placeholder(tf.float32,[None,1],name="y_input")

l1 = add_layer(xs,1,10,activation_function=tf.nn.relu)  # 隐藏层
prediction = add_layer(l1,10,1,activation_function = None)  # 输出层

with tf.name_scope('loss'):
    loss = tf.reduce_mean(tf.reduce_sum(tf.square(ys-prediction),reduction_indices=[1]))  # 误差
with tf.name_scope('train'):
    train_step = tf.train.GradientDescentOptimizer(0.1).minimize(loss)

sess = tf.Session()
writer = tf.summary.FileWriter("F:/tfLogs/",sess.graph)
init = tf.global_variables_initializer() # 初始化所有变量
sess.run(init)
注意:
下面这句代码中,"F:/tfLogs/”表示的是输出的可视化图像的位置,可以根据自己的情况进行指定,我的是放在了f盘下。
writer = tf.summary.FileWriter("F:/tfLogs/",sess.graph)
操作步骤:
1、准备好代码后,点击run 运行程序,不报错误
会在目录下生成类似这样的文件:events.out.tfevents.1533782924
2、转到pycharm 的Terminal下
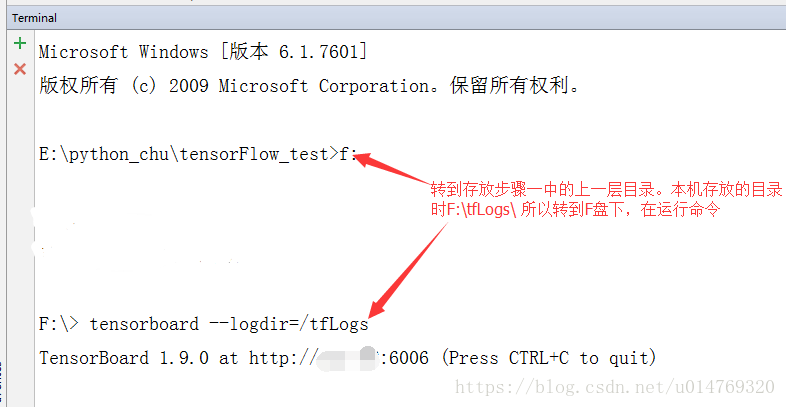
3、复制Terminal中http 网址,放到浏览器中:双击节点,便能打开神经网络中的节点了