有助于理解模型的实用工具
这是完整的代码:只需复制并粘贴到Jupyter Notebook或Python脚本中,替换为您的数据并运行:
from sklearn.datasets import load_iris
iris = load_iris()

# 模型(也可以使用单一决策树)
from sklearn.ensemble import RandomForestClassifier
model = RandomForestClassifier(n_estimators=10)

# Train
model.fit(iris.data, iris.target)
# 提取单一的树
estimator = model.estimators_[5]

from sklearn.tree import export_graphviz
# Export as dot file
export_graphviz(estimator, out_file='tree.dot',
                feature_names = iris.feature_names,
                class_names = iris.target_names,
                rounded = True, proportion = False,
                precision = 2, filled = True)

# 使用系统命令转换为png(需要Graphviz)
from subprocess import call
call(['dot', '-Tpng', 'tree.dot', '-o', 'tree.png', '-Gdpi=600'])

# 显示在jupyter笔记本
from IPython.display import Image
Image(filename = 'tree.png')用于可视化决策树并保存为png的代码(在GitHub上)。
最终结果是一个完整的决策树作为图像。
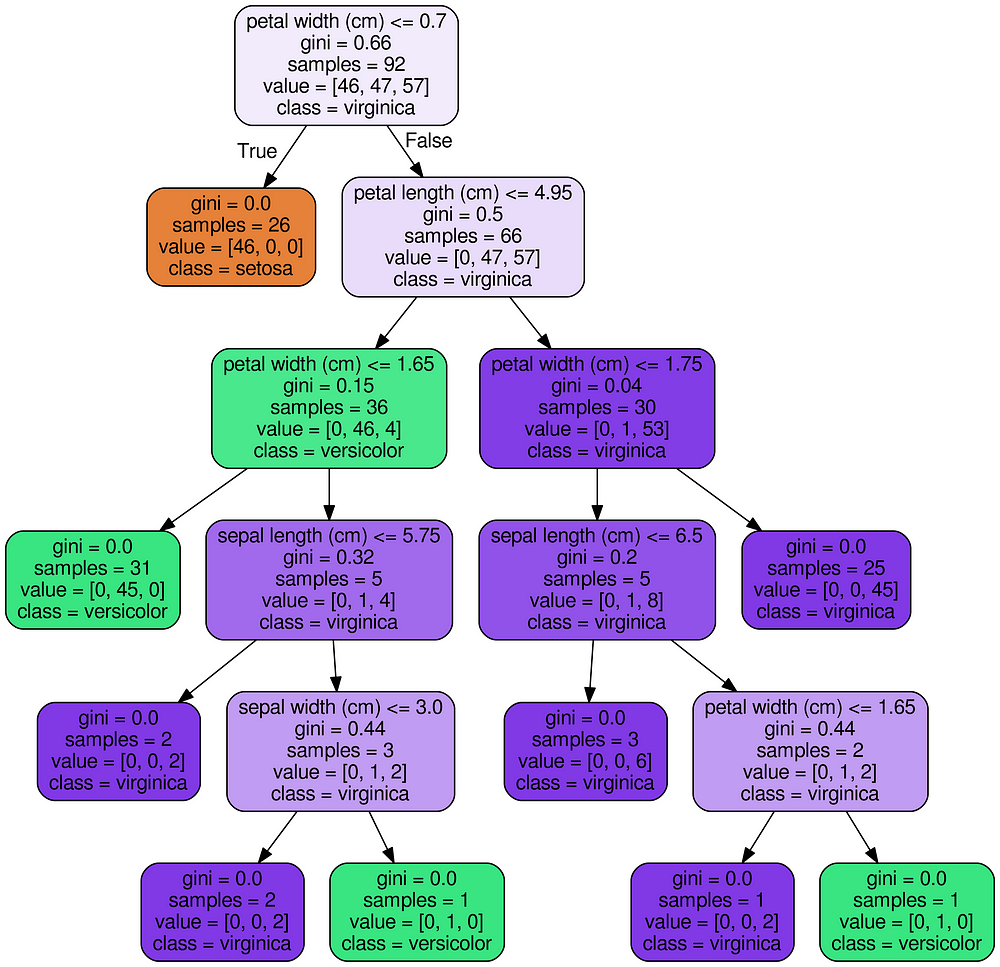
Iris数据集的决策树
代码说明
- 创建模型训练和提取:我们可以使用单个决策树,但由于我经常使用随机森林进行建模,因此在本例中使用了它。(树木会彼此略有不同!)。
from sklearn.ensemble import RandomForestClassifier
model = RandomForestClassifier(n_estimators=10)
# Train
model.fit(iris.data, iris.target)
# Extract single tree
estimator = model.estimators_[5]2.将树导出为.dot文件:这将使用export_graphvizScikit-Learn 中的功能。这里有许多参数可以控制显示的外观和信息。请查看文档以了解具体信息。
from sklearn.tree import export_graphviz
# Export as dot file
export_graphviz(estimator_limited,
                out_file='tree.dot',
                feature_names = iris.feature_names,
                class_names = iris.target_names,
                rounded = True, proportion = False,
precision = 2, filled = True)3.转换dot为png使用系统命令:在Python中运行系统命令可以方便执行简单任务。这需要安装包含dot实用程序的graphviz。有关转换的完整选项,请查看文档。
# Convert to png
from subprocess import call
call(['dot', '-Tpng', 'tree.dot', '-o', 'tree.png', '-Gdpi=600'])4.可视化:Jupyter笔记本中出现最佳可视化效果。(等效地,您可以matplotlib用来显示图像)。
# Display in jupyter notebook
from IPython.display import Image
Image(filename = 'tree.png')
注意事项
随机森林,每棵树将以不同的方式建造。我使用这些图像来显示决策树(以及随后的随机森林)背后的推理,而不是具体细节。
当您拥有许多功能时,限制树木的最大深度会很有帮助。否则,你最终会看到巨大的树木,看起来令人印象深刻,但根本无法解释!这是一个包含50个功能的完整示例。
结论
机器学习仍然存在黑盒问题,一个图像无法解决问题!尽管如此,查看单个决策树会向我们展示这个模型(和随机森林)不是一个无法解释的方法,而是一系列逻辑问题和答案 - 就像我们在做出预测时所形成的那样。您可以随意使用和修改此代码以获取数据。
与往常一样,我欢迎反馈,建设性批评和听取您的数据科学项目。