版权声明:本文为博主原创文章,未经博主允许不得转载。 https://blog.csdn.net/qq_33434901/article/details/82216351
回顾了一下上一节提到的TF模块化套路后,导入Boston房价数据集做了个回归预测,没有使用公式化的评价指标(小程序,没必要),反而觉得画出数据点图像更直观有趣一些,另外,也有了点有趣的想法,被质疑不可行[手动笑哭],希望研究一下可以实现,变得可行。该数据集为TF框架自带的数据集,共有13个维度,506条数据,信息如下:
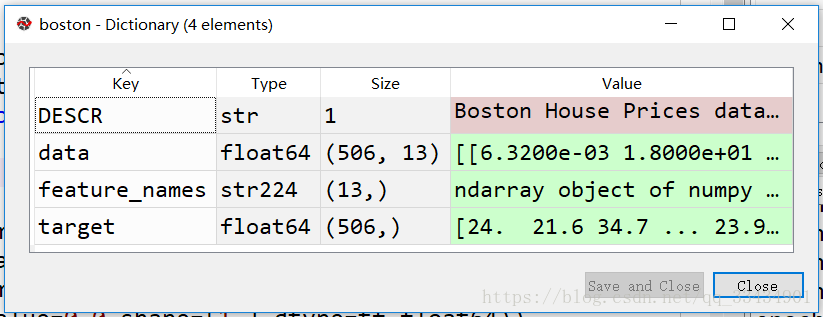
代码如下(小神经网络共有两层,其中隐藏层有5个神经元):
# -*- coding: utf-8 -*-
"""
Created on Wed Aug 29 14:18:59 2018
@author: Zhengyuv
"""
import tensorflow as tf
from sklearn.datasets import load_boston
import matplotlib.pyplot as plt
from sklearn.preprocessing import MinMaxScaler
#boston=load_boston()
w1 = tf.Variable(tf.random_normal(shape=[13,5],dtype=tf.float64,stddev=0.001))
b1 = tf.Variable(tf.constant(value=0.0,shape=[5,],dtype=tf.float64))
w2 = tf.Variable(tf.random_normal(shape=[5,1],dtype=tf.float64,stddev=0.001))
b2 = tf.Variable(tf.constant(value=0.0,shape=[1,],dtype=tf.float64))
def inference(X):
a = tf.nn.relu(tf.matmul(X,w1)+b1)
return tf.matmul(a,w2)+b2
def loss(X,Y):
Y_predict = inference(X)
return Y_predict,tf.reduce_mean(tf.squared_difference(Y,Y_predict))
def inputs():
boston = load_boston()
minMax = MinMaxScaler()
X = minMax.fit_transform(boston.data)
target=boston.target.reshape(-1,1)
Y = minMax.fit_transform(target)
return X,Y
def train(total_loss):
lr = 0.01
return tf.train.GradientDescentOptimizer(lr).minimize(total_loss)
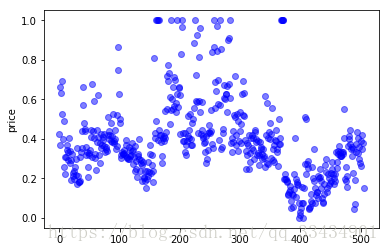
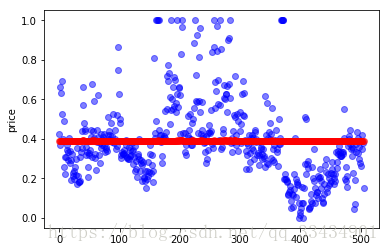
def plot_fun(Y,Y_p):
# =============================================================================
# plt.figure()
# plt.plot(Y,'bo',alpha=0.5)
# plt.ylabel('price')
# =============================================================================
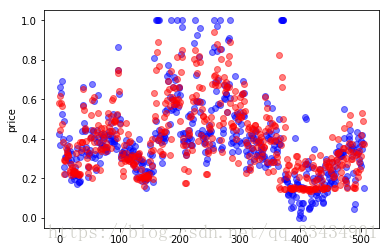
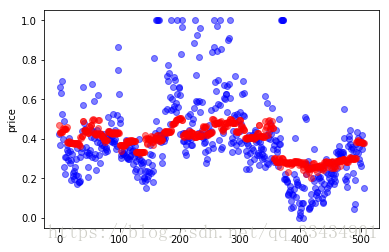
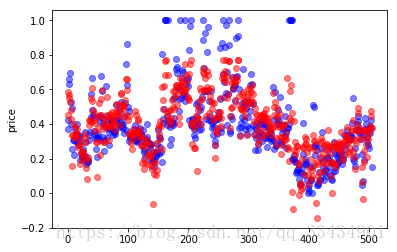
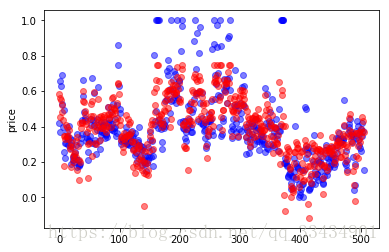
plt.figure()
plt.plot(Y,'bo',alpha=0.5)
plt.plot(Y_p,'ro',alpha=0.5)
plt.ylabel('price')
plt.show()
#def evaluate():
with tf.Session() as sess:
sess.run(tf.global_variables_initializer())
X,Y=inputs()
Y_predict,total_loss = loss(X,Y)
train_op = train(total_loss)
train_steps = 1000
for i in range(train_steps):
sess.run(train_op)
if i%10 == 0:
print("epoch",i,"loss:",sess.run(total_loss))
Y_p=sess.run(Y_predict)
plot_fun(Y,Y_p)
sess.close()