转载自勤奋的小青蛙
1:原有列基础生成新列
常见使用情景:两列相减的值为新的一列,或者多列操作生成新的一列
技巧:
| 1 2 3 4 5 6 7 8 9 10 11 12 13 14 15 16 17 18 19 20 |
|
2:如何遍历Pandas Dataframe每一行
| 1 2 3 4 5 6 7 8 9 10 11 |
|
详见:https://stackoverflow.com/questions/16476924/how-to-iterate-over-rows-in-a-dataframe-in-pandas
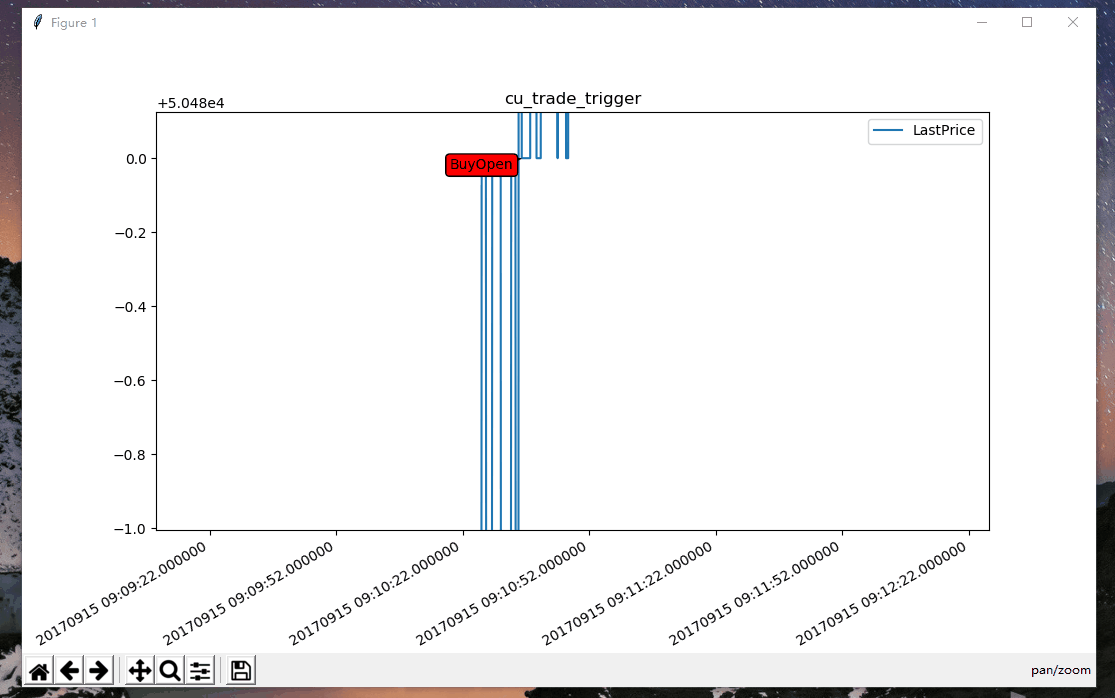
3:Pandas Dataframe通过matplotlib画图如何鼠标滚轮缩放
主要缩放函数:
| 1 2 3 4 5 6 7 8 9 10 11 12 13 14 15 16 17 18 19 20 21 22 23 24 25 26 27 28 29 30 31 32 33 34 35 |
|
如何使用(直接对matplotlib的轴对象ax进行操作即可):
|
|
可选参数base_scale允许您将比例因子设置为您想要的值。
一定要确保缩放函数有个返回值对象f。所以如果你不保存f,该缩放返回值可能被垃圾回收。
演示:
详见:https://stackoverflow.com/questions/11551049/matplotlib-plot-zooming-with-scroll-wheel
4:pandas更改索引,更改index为某列
| 1 2 3 4 5 6 7 8 9 10 11 12 13 14 15 16 17 18 19 20 |
|
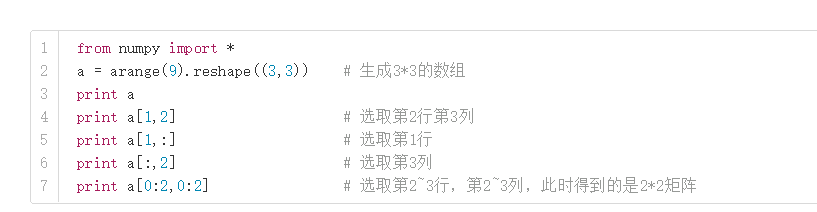
5:ndarray切片区域选取
| 1 2 3 4 5 6 7 8 9 10 11 12 13 14 15 16 17 18 19 20 21 22 23 24 25 26 |
|
语法:中括号中第一个选取就是行,第二个选取的就是列,中间用逗号隔开。
6:新增一列是某列的累加
| 1 2 3 4 5 6 7 8 9 10 |
|