翻译自 MATLAB 官方文档
- surf : 曲面图
- surfc : 带等高线的曲面图
- surface:创建曲面对象
- surfl : 具有基于颜色图的光照的曲面图
- surfnorm : 计算并显示三维曲面法向向量
- mesh : 网格图
- meshc : 带等高线的网格图
- meshz : 围绕网格图绘制帷幕
- hidden:显示网格图中被遮挡的隐线
- fsurf:解析方程绘制三维曲面
- fmesh:解析方程绘制三维网格图
- fimplicit : 绘制三维隐函数
- waterfall : 瀑布图
- ribbon : 条带图
- contour3 : 3D 等高线图
- peaks: 包含两个变量的示例函数
- cylinder : 生成圆柱面
- ellipsoid : 生成椭球面
- sphere: 生成球面
- [pcolor : 伪彩图/棋盘图]
surf : 曲面图
[X,Y] = meshgrid(1:0.5:10,1:20);
Z = sin(X) + cos(Y);
C = X.*Y;
surf(X,Y,Z,C)
colorbar
surfc : 带等高线的曲面图
[X,Y,Z] = peaks(30);
figure
surfc(X,Y,Z)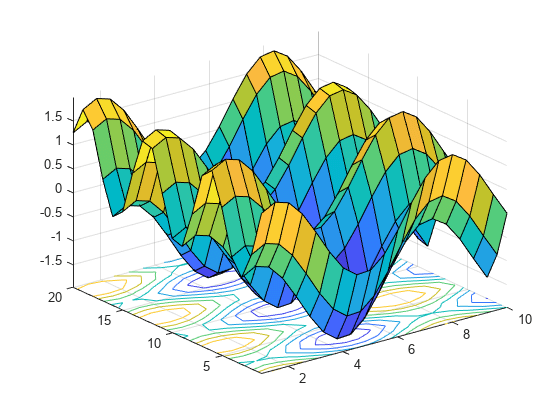
surface:创建曲面对象
surface 是一个创建曲面图形对象的低级函数。曲面是将每个元素的行和列索引用作 x 和 y 坐标、将每个元素的值用作 z 坐标而创建的矩阵数据图。
[XD,YD,ZD] = peaks(25);


load clown
C = flipud(X);

figure
surface(XD,YD,ZD,C,...
    'FaceColor','texturemap',...
    'EdgeColor','none',...
    'CDataMapping','direct')
colormap(map)
view(-35,45)
surfl : 具有基于颜色图的光照的曲面图
surfl 函数基于环境光、漫反射和镜面反射光照模型显示阴影曲面。
[x,y] = meshgrid(-3:1/8:3);
z = peaks(x,y);
surfl(x,y,z)
shading interp
使用基于颜色图的光照创建 peaks 函数的曲面图。将 shading 设置为 interp 以在各线条和面间插入颜色。

surfnorm : 计算并显示三维曲面法向向量
[x,y,z] = cylinder(1:10);
figure
surfnorm(x,y,z)
axis([-12 12 -12 12 -0.1 1])
mesh : 网格图
 [X,Y] = meshgrid(-8:.5:8);
R = sqrt(X.^2 + Y.^2) + eps;
Z = sin(R)./R;
C = gradient(Z);

figure
mesh(X,Y,Z,C)
meshc : 带等高线的网格图
figure
[X,Y] = meshgrid(-3:.125:3);
Z = peaks(X,Y);
meshc(Z)

meshz : 围绕网格图绘制帷幕
figure
[X,Y] = meshgrid(-3:.125:3);
Z = peaks(X,Y);
meshz(Z)
hidden:显示网格图中被遮挡的隐线
figure
mesh(peaks)

hidden off
fsurf:解析方程绘制三维曲面
绘制分段表达式函数
f1 = @(x,y) erf(x)+cos(y);
fsurf(f1,[-5 0 -5 5])
hold on
f2 = @(x,y) sin(x)+cos(y);
fsurf(f2,[0 5 -5 5])
hold off
fmesh:解析方程绘制三维网格图
fmesh(@(x,y) erf(x)+cos(y),[-5 0 -5 5])
hold on
fmesh(@(x,y) sin(x)+cos(y),[0 5 -5 5])
hold off
fimplicit : 绘制三维隐函数
f = @(x,y,z) x.^2 + y.^2 - z.^2;
fimplicit3(f)
waterfall : 瀑布图
figure
[X,Y,Z] = peaks(30);
waterfall(X,Y,Z)
ribbon : 条带图
[x,y] = meshgrid(-3:.5:3,-3:.1:3);
z = peaks(x,y);

figure
ribbon(y,z)
contour3 : 3D 等高线图
x = -2:0.25:2;
[X,Y] = meshgrid(x);
Z = X.*exp(-X.^2-Y.^2);
contour3(X,Y,Z,30)
peaks: 包含两个变量的示例函数
peaks 是从高斯分布转换和缩放得来的包含两个变量的函数
figure
peaks(5);
cylinder : 生成圆柱面
生成剖面函数 定义的圆柱
t = 0:pi/10:2*pi;
figure
[X,Y,Z] = cylinder(2+cos(t));
surf(X,Y,Z)
axis square
图中的圆柱是将x-y 坐标轴的函数作为剖面曲线,将此曲线绕 x 轴旋转至与 z 轴对齐,然后绕 z 轴旋转一周,形成圆柱曲面

ellipsoid : 生成椭球面
[x, y, z] = ellipsoid(0,0,0,5.9,3.25,3.25,30);
figure
surf(x, y, z)
axis equal
sphere: 生成球面
[x,y,z] = sphere;

figure
surf(x,y,z)

hold on
surf(x+3,y-2,z) % centered at (3,-2,0)
surf(x,y+1,z-3) % centered at (0,1,-3)
[pcolor : 伪彩图/棋盘图]
pcolor(hadamard(20))
colormap(gray(2))
axis ij
axis square