1、设置图形对象属性值
set(h,'属性名称','属性值')
>> subplot(1,2,1);
h1=line([0 1],[0 1]);
text(0,0.5,'unchange');
subplot(1,2,2);
h2=line([0 1],[0 1]);
set(h2,'linewidth',4);
text(0,0.5,'change');
2、基本二维绘图函数
- plot

x=0:0.25:2*pi;
y=sin(x);
plot(x,y,'-ro','linewidth',2,'markeredgecolor','b','markerfacecolor','0.49,1,0.65','markersize',14);
>> xlabel('x');
>> ylabel('y')

2. loglog:双对数坐标绘图
>> x=logspace(-1,2);
loglog(x,exp(x),'-s');
grid on
xlabel('x')
ylabel('y')

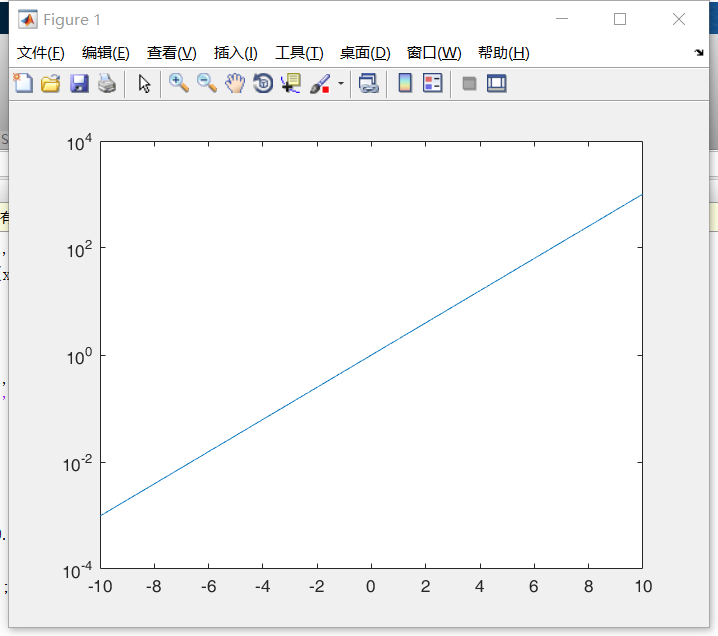
3. semilogx,semilogy:半对数坐标绘图
>> x=-10:0.001:10;
semilogy(x,2.^x);
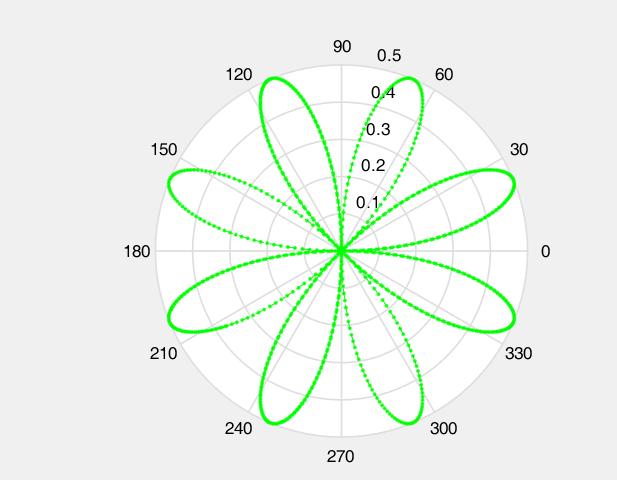
4. polar:极坐标绘图
>> t=0:0.01:10;
polar(t,sin(2*t).*cos(2*t),'--.g')
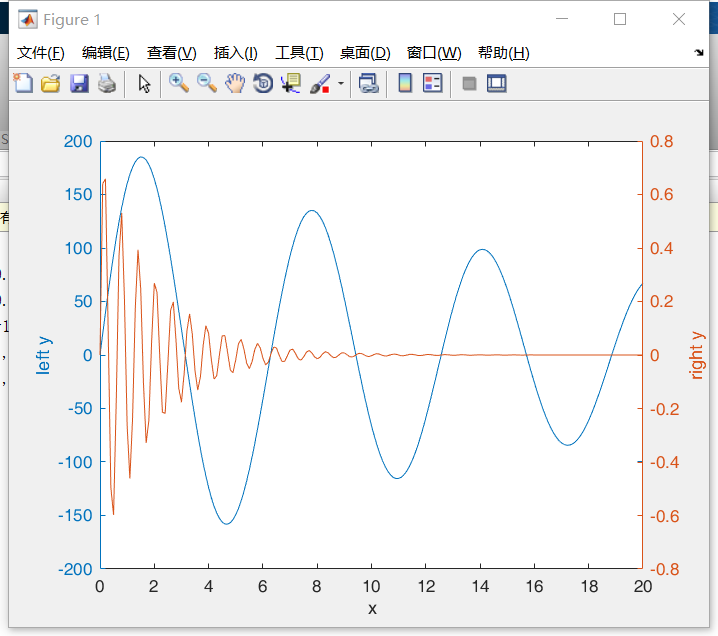
5. plotyy:双纵坐标绘图
>> x=0:0.1:20;
>> y1=200*exp(-0.05*x).*sin(x);
>> y2=0.8*exp(-0.5*x).*sin(10*x);
>> ax=plotyy(x,y1,x,y2,'plot');xlabel('x');
>> set(get(ax(1),'ylabel'),'string','left y');
>> set(get(ax(2),'ylabel'),'string','right y');
3、二维图形修饰和添加注释