运行环境:win10 64位 py 3.6 pycharm 2018.1.1
import matplotlib.pyplot as plt
import numpy as np
from sklearn import datasets,linear_model,cross_validation,svm
def load_data_regression():
    diabetes = datasets.load_diabetes()
    return cross_validation.train_test_split(diabetes.data,diabetes.target,test_size=0.25,random_state=0)
def test_LinearSVR(*data):
X_train,X_test,y_train,y_test = data
cls = svm.LinearSVR()
cls.fit(X_train,y_train)
print('Coefficients:%s,intercept%s'%(cls.coef_,cls.intercept_))
print('Score:%.2f'%cls.score(X_test,y_test))
X_train,X_test,y_train,y_test = load_data_regression()
test_LinearSVR(X_train,X_test,y_train,y_test)
def test_LinearSVR_loss(*data):
X_train,X_test,y_train,y_test = data
losses = ['epsilon_insensitive','squared_epsilon_insensitive']
for loss in losses:
regr = svm.LinearSVR(loss=loss)
regr.fit(X_train,y_train)
print('loss:%s'%loss)
print('Coefficients:%s,intercept%s'%(regr.coef_,regr.intercept_))
print('Score:%.2f'%regr.score(X_test,y_test))
X_train,X_test,y_train,y_test = load_data_regression()
test_LinearSVR_loss(X_train,X_test,y_train,y_test)
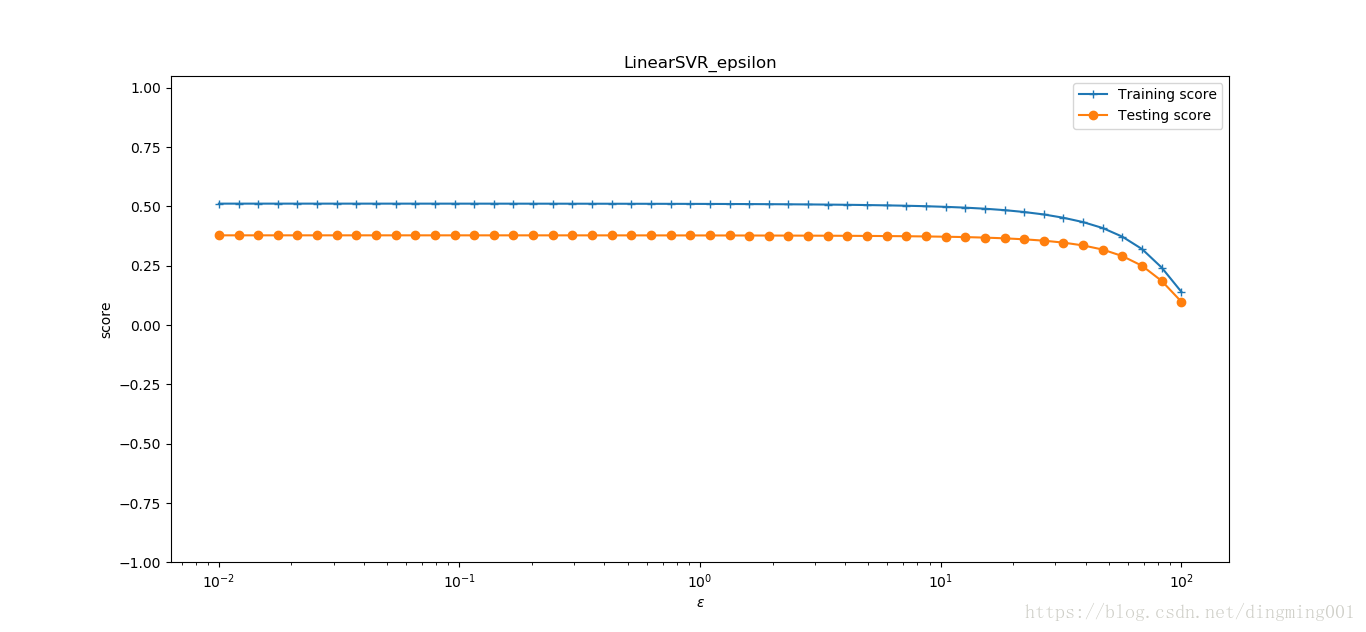
def test_LinearSVR_epsilon(*data):
X_train,X_test,y_train,y_test = data
epsilons = np.logspace(-2,2)
train_scores = []
test_scores = []
for epsilon in epsilons:
regr = svm.LinearSVR(epsilon=epsilon,loss='squared_epsilon_insensitive')
regr.fit(X_train,y_train)
train_scores.append(regr.score(X_train,y_train))
test_scores.append(regr.score(X_test,y_test))
fig = plt.figure()
ax = fig.add_subplot(1,1,1)
ax.plot(epsilons,train_scores,label = 'Training score',marker='+')
ax.plot(epsilons,test_scores,label = 'Testing score',marker='o')
ax.set_xscale('log')
ax.set_xlabel(r'$\epsilon$')
ax.set_ylabel(r'score')
ax.set_ylim(-1,1.05)
ax.set_title('LinearSVR_epsilon')
ax.legend(loc='best')
plt.show()
X_train,X_test,y_train,y_test = load_data_regression()
test_LinearSVR_epsilon(X_train,X_test,y_train,y_test)
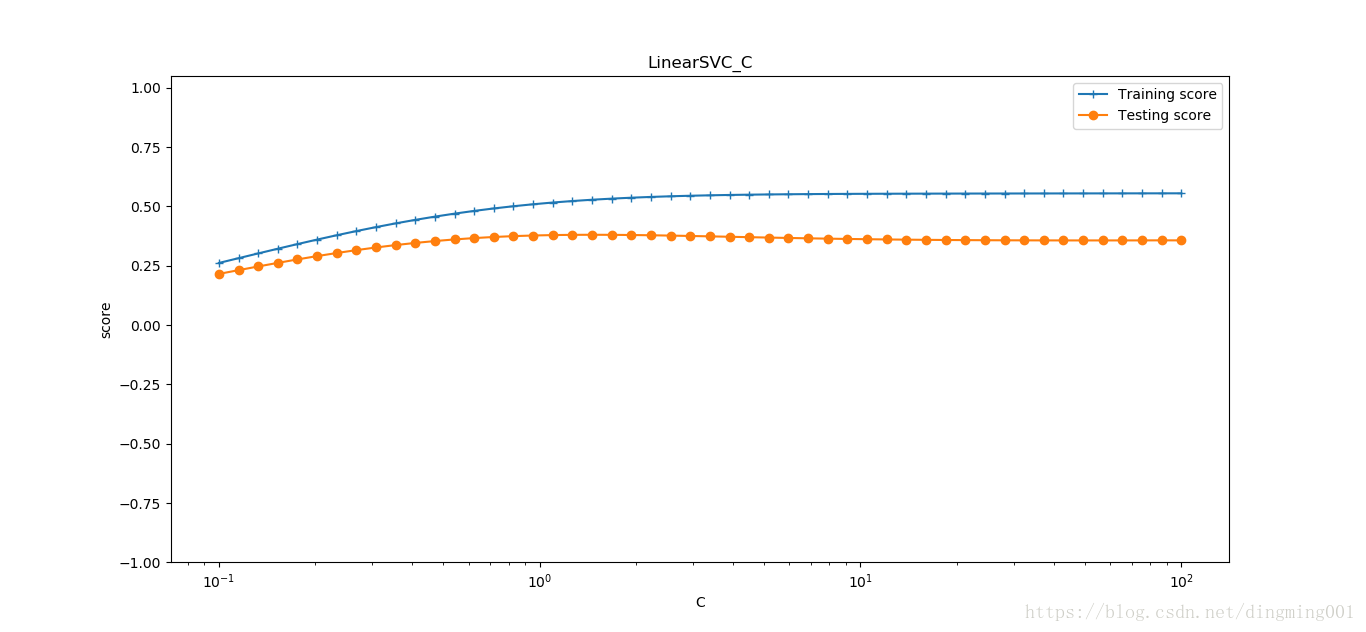
def test_LinearSVR_C(*data):
X_train,X_test,y_train,y_test = data
Cs = np.logspace(-1,2)
train_scores = []
test_scores = []
for C in Cs:
regr = svm.LinearSVR(epsilon=0.1, loss='squared_epsilon_insensitive',C=C)
regr.fit(X_train,y_train)
train_scores.append(regr.score(X_train,y_train))
test_scores.append(regr.score(X_test,y_test))
fig = plt.figure()
ax = fig.add_subplot(1,1,1)
ax.plot(Cs,train_scores,label = 'Training score',marker='+')
ax.plot(Cs,test_scores,label = 'Testing score',marker='o')
ax.set_xlabel(r'C')
ax.set_xscale('log')
ax.set_ylabel(r'score')
ax.set_ylim(-1, 1.05)
ax.set_title('LinearSVC_C')
ax.legend(loc='best')
plt.show()
X_train,X_test,y_train,y_test = load_data_regression()
test_LinearSVR_C(X_train,X_test,y_train,y_test)
def test_SVR_linear(*data):
X_train, X_test, y_train, y_test = data
regr = svm.SVR(kernel='linear')
regr.fit(X_train,y_train)
print('Coefficients:%s,intercept%s'%(regr.coef_,regr.intercept_))
print('Score:%.2f'%regr.score(X_test,y_test))
X_train,X_test,y_train,y_test = load_data_regression()
test_SVR_linear(X_train,X_test,y_train,y_test)
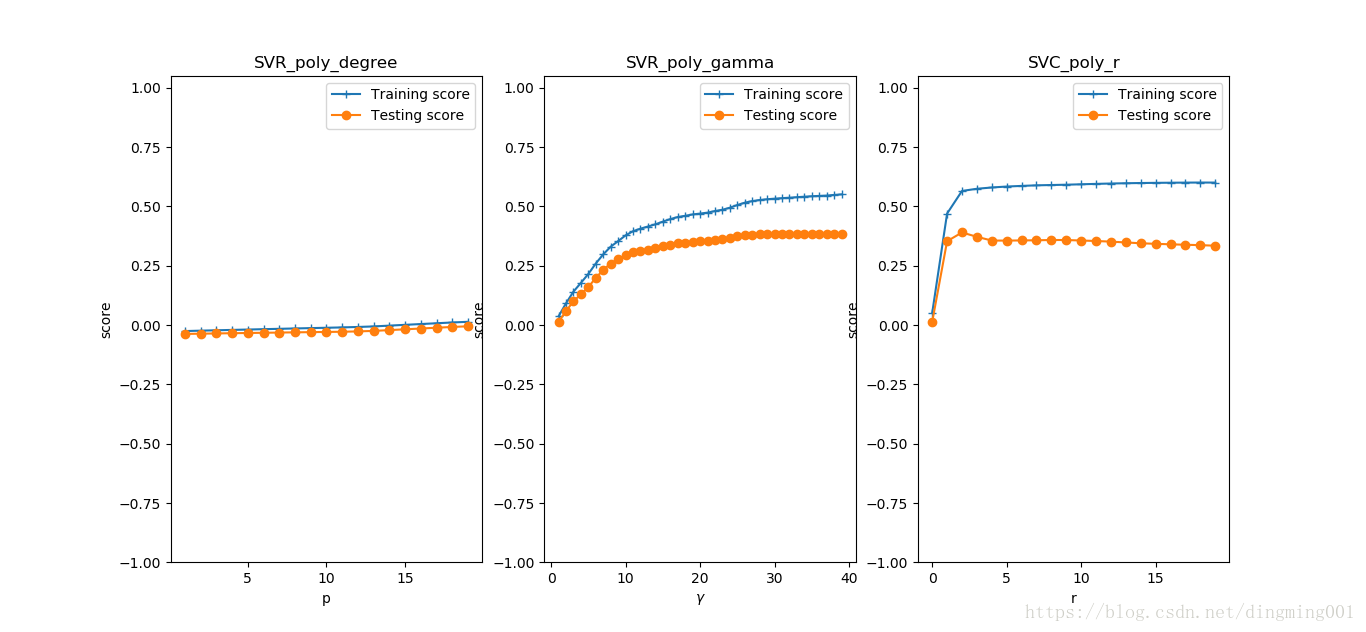
def test_SVR_poly(*data):
X_train, X_test, y_train, y_test = data
fig = plt.figure()
degrees = range(1, 20)
train_scores = []
test_scores = []
for degree in degrees:
regr = svm.SVR(kernel='poly',degree=degree,coef0=1)
regr.fit(X_train,y_train)
train_scores.append(regr.score(X_train, y_train))
test_scores.append(regr.score(X_test,y_test))
ax = fig.add_subplot(1,3,1)
ax.plot(degrees,train_scores,label = 'Training score',marker='+')
ax.plot(degrees,test_scores,label = 'Testing score',marker='o')
ax.set_xlabel(r'p')
ax.set_ylabel(r'score')
ax.set_ylim(-1,1.05)
ax.set_title('SVR_poly_degree')
ax.legend(loc='best')
gamms = range(1, 40)
train_scores = []
test_scores = []
for gamm in gamms:
regr = svm.SVR(kernel='poly', gamma=gamm, degree=3, coef0=1)
regr.fit(X_train, y_train)
train_scores.append(regr.score(X_train, y_train))
test_scores.append(regr.score(X_test, y_test))
ax = fig.add_subplot(1, 3, 2)
ax.plot(gamms, train_scores, label='Training score', marker='+')
ax.plot(gamms, test_scores, label='Testing score', marker='o')
ax.set_xlabel(r'$\gamma$')
ax.set_ylabel(r'score')
ax.set_ylim(-1, 1.05)
ax.set_title('SVR_poly_gamma')
ax.legend(loc='best')
rs = range(0, 20)
train_scores = []
test_scores = []
for r in rs:
cls = svm.SVR(kernel='poly', gamma=20, degree=3, coef0=r)
cls.fit(X_train, y_train)
train_scores.append(cls.score(X_train, y_train))
test_scores.append(cls.score(X_test, y_test))
ax = fig.add_subplot(1, 3, 3)
ax.plot(rs, train_scores, label='Training score', marker='+')
ax.plot(rs, test_scores, label='Testing score', marker='o')
ax.set_xlabel(r'r')
ax.set_ylabel(r'score')
ax.set_ylim(-1, 1.05)
ax.set_title('SVC_poly_r')
ax.legend(loc='best')
plt.show()
X_train,X_test,y_train,y_test = load_data_regression()
test_SVR_poly(X_train,X_test,y_train,y_test)
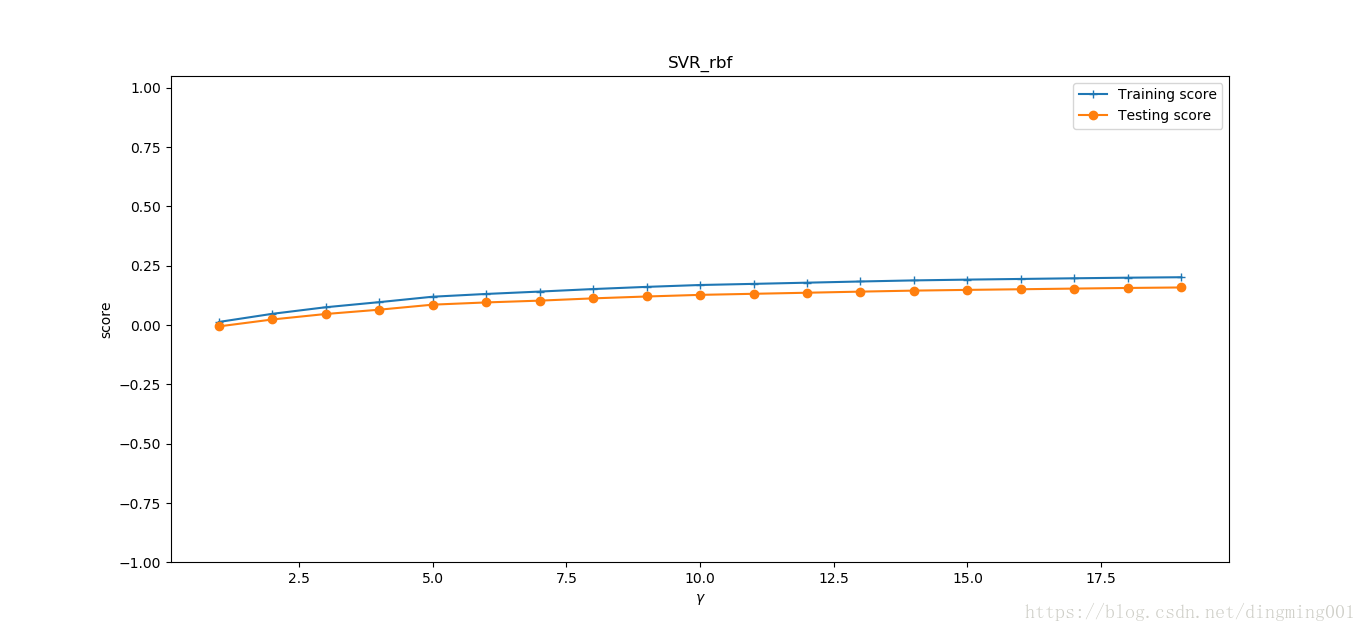
def test_SVR_rbf(*data):
X_train, X_test, y_train, y_test = data
gamms = range(1, 20)
train_scores = []
test_scores = []
for gamm in gamms:
regr = svm.SVR(kernel='rbf', gamma=gamm)
regr.fit(X_train, y_train)
train_scores.append(regr.score(X_train, y_train))
test_scores.append(regr.score(X_test, y_test))
fig = plt.figure()
ax = fig.add_subplot(1, 1, 1)
ax.plot(gamms, train_scores, label='Training score', marker='+')
ax.plot(gamms, test_scores, label='Testing score', marker='o')
ax.set_xlabel(r'$\gamma$')
ax.set_ylabel(r'score')
ax.set_ylim(-1, 1.05)
ax.set_title('SVR_rbf')
ax.legend(loc='best')
plt.show()
X_train,X_test,y_train,y_test = load_data_regression()
test_SVR_rbf(X_train,X_test,y_train,y_test)
def test_SVR_sigmod(*data):
X_train, X_test, y_train, y_test = data
fig = plt.figure()
gamms = np.logspace(-1, 3)
train_scores = []
test_scores = []
for gamm in gamms:
regr = svm.SVR(kernel='sigmoid',gamma=gamm,coef0=0.01)
regr.fit(X_train, y_train)
train_scores.append(regr.score(X_train, y_train))
test_scores.append(regr.score(X_test, y_test))
ax = fig.add_subplot(1, 2, 1)
ax.plot(gamms, train_scores, label='Training score', marker='+')
ax.plot(gamms, test_scores, label='Testing score', marker='o')
ax.set_xlabel(r'$\gamma$')
ax.set_ylabel(r'score')
ax.set_xscale('log')
ax.set_ylim(-1, 1.05)
ax.set_title('SVR_sigmoid_gamm')
ax.legend(loc='best')
rs = np.linspace(0,5)
train_scores = []
test_scores = []
for r in rs:
regr = svm.SVR(kernel='sigmoid', gamma=10, coef0=r)
regr.fit(X_train, y_train)
train_scores.append(regr.score(X_train, y_train))
test_scores.append(regr.score(X_test, y_test))
ax = fig.add_subplot(1, 2, 2)
ax.plot(rs, train_scores, label='Training score', marker='+')
ax.plot(rs, test_scores, label='Testing score', marker='o')
ax.set_xlabel(r'r')
ax.set_ylabel(r'score')
ax.set_ylim(-1, 1.05)
ax.set_title('SVR_sigmoid_r')
ax.legend(loc='best')
plt.show()
X_train,X_test,y_train,y_test = load_data_regression()
test_SVR_sigmod(X_train,X_test,y_train,y_test)
