今天介绍如何利用卷积神经网络进行MNIST数据集的手写数字识别,即将手写数字图像images识别为数字标签labels
目录
建模思路如下图:
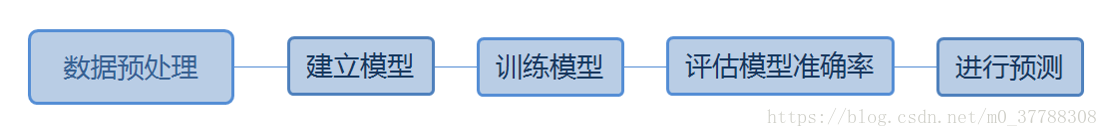
数据预处理
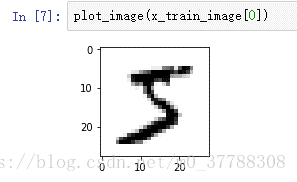
MNIST数据集共有训练数据60 000项、测试数据10 000项。其数据都由images(数字图像)与labels(真实的数字)所组成
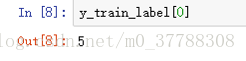
尝试调用该数据集的第0项
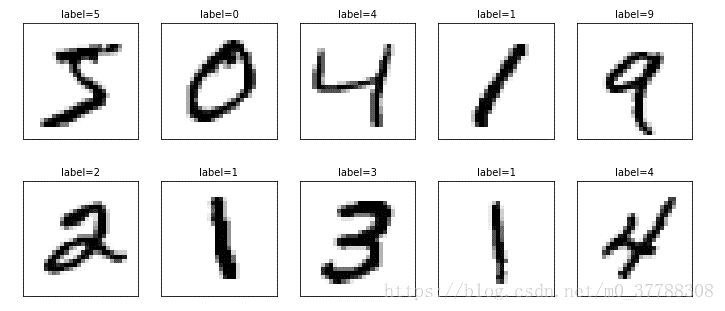
下面展示数据集的前十项:
接下来进行数据预处理
1、 导入所需模块
2、读取数据

3、将fetures(数字图像特征值)转换为6000 x 28 x 28 x 1的四维矩阵

模型建立
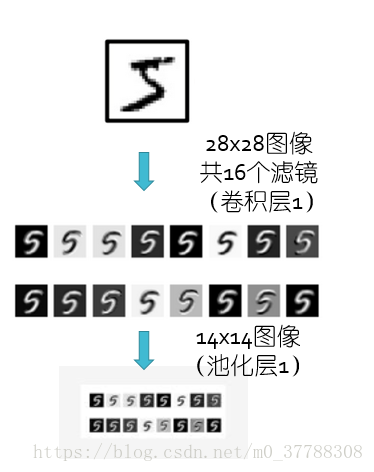
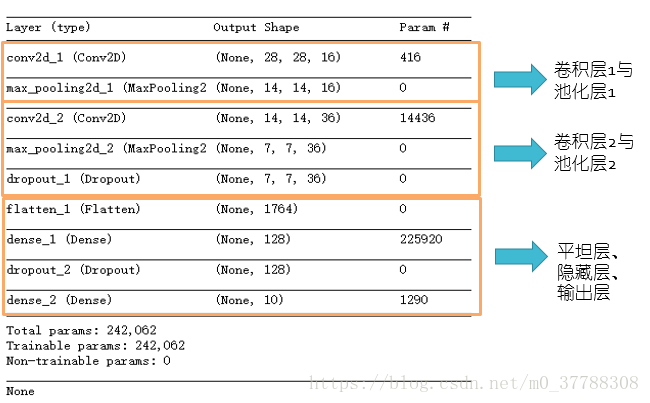
解释一下,这里的卷积层1是将一张手写数字图像以16个滤镜进行分解,分别侧重于同一张图片中不同的特征,池化层1是将分解得到的16张图片中与识别无关的信息切除,直观看来是将图片切掉了1/2大小。
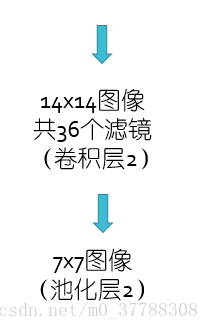
卷积层2和池化层2做的工作相似。
我们可以运用代码查看模型概况:
评估模型准确率
训练模型之后,我们用识别准确率对模型好坏进行评估。
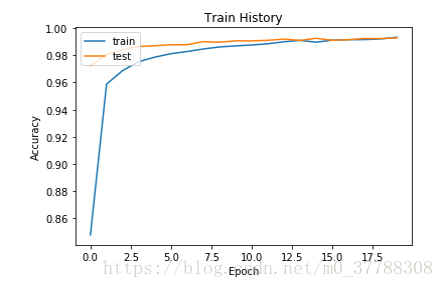
训练的准确率变化以橙色表出,验证的准确率变化以蓝色表出
可以发现,无论是训练还是验证,准确率都越来越高
也可以查看误差率变化曲线,它是(1-准确率)的结果
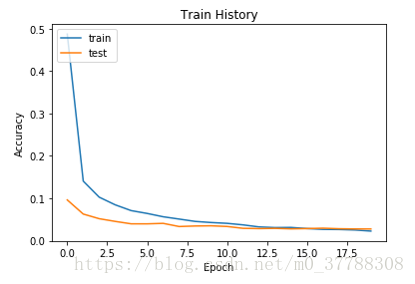
同样的,训练误差以蓝色表示,验证误差以橙色表示
可以发现,训练和验证的误差都越来越低
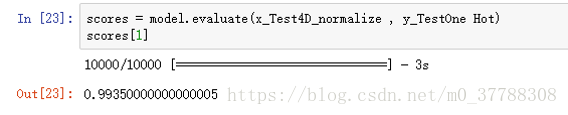
使用测试数据集来评估模型准确性,可以发现,其精确度高达0.99
进行预测
查看训练结果中的前十项,及其真实值及预测结果
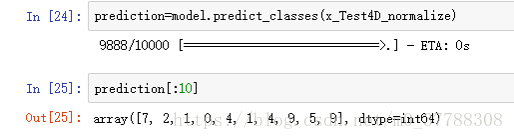
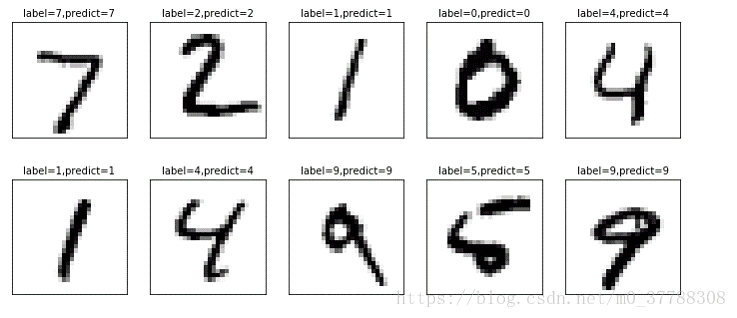
可以看到,前十项的预测都是准确的。
运用混淆矩阵查看预测正确的和错误的分别对应哪些数字
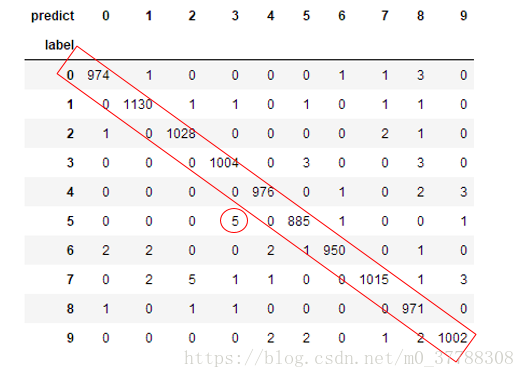
对角线上是预测正确的数字,其他非对角线的数字为错误预测。例如,有5个原本为5的数字被预测成了3,980个原本为0的图片中有974个被正确的预测为0。
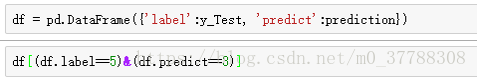
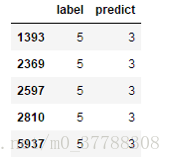
再来查看真实值为5但是却被错误预测为3的图片编号
下面请看详细代码:
# coding: utf-8

from keras.datasets import mnist
from keras.utils import np_utils
import numpy as np
np.random.seed(10)


# # 数据预处理

# In[2]:


(x_Train, y_Train), (x_Test, y_Test) = mnist.load_data()


# In[3]:


x_Train4D=x_Train.reshape(x_Train.shape[0],28,28,1).astype('float32')#将图像特征值转换为四维矩阵
x_Test4D=x_Test.reshape(x_Test.shape[0],28,28,1).astype('float32')


# In[4]:


x_Train4D_normalize = x_Train4D / 255#将图像特征值(features)标准化可以提高模型预测的准确度,并且更快收敛
x_Test4D_normalize = x_Test4D / 255


# In[6]:


y_TrainOneHot = np_utils.to_categorical(y_Train)#将训练数据和测试数据的label进行one-hot encoding转换
y_TestOneHot = np_utils.to_categorical(y_Test)


# # 建立模型

# In[7]:


from keras.models import Sequential
from keras.layers import Dense,Dropout,Flatten,Conv2D,MaxPooling2D


# In[8]:


model = Sequential()


# In[9]:


model.add(Conv2D(filters=16,
                 kernel_size=(5,5),
                 padding='same',
                 input_shape=(28,28,1),
                 activation='relu'))


# In[10]:


model.add(MaxPooling2D(pool_size=(2, 2)))


# In[11]:


model.add(Conv2D(filters=36,
                 kernel_size=(5,5),
                 padding='same',
                 activation='relu'))


# In[12]:


model.add(MaxPooling2D(pool_size=(2, 2)))


# In[13]:


model.add(Dropout(0.25))


# In[14]:


model.add(Flatten())


# In[15]:


model.add(Dense(128, activation='relu'))


# In[16]:


model.add(Dropout(0.5))


# In[17]:


model.add(Dense(10,activation='softmax'))


# In[18]:


print(model.summary())


# # 训练模型

# In[19]:


model.compile(loss='categorical_crossentropy',
              optimizer='adam',metrics=['accuracy'])


# In[19]:


train_history=model.fit(x=x_Train4D_normalize,
                        y=y_TrainOneHot,validation_split=0.2,
                        epochs=20, batch_size=300,verbose=2)


# In[23]:


import matplotlib.pyplot as plt
def show_train_history(train_acc,test_acc):
    plt.plot(train_history.history[train_acc])
    plt.plot(train_history.history[test_acc])
    plt.title('Train History')
    plt.ylabel('Accuracy')
    plt.xlabel('Epoch')
    plt.legend(['train', 'test'], loc='upper left')
    plt.show()


# In[24]:


show_train_history('acc','val_acc')


# In[22]:


show_train_history('loss','val_loss')


# # 评估模型的准确率

# In[23]:


scores = model.evaluate(x_Test4D_normalize , y_TestOneHot)
scores[1]


# # 预测结果

# In[24]:


prediction=model.predict_classes(x_Test4D_normalize)


# In[25]:


prediction[:10]


# # 查看预测结果

# In[26]:


import matplotlib.pyplot as plt
def plot_images_labels_prediction(images,labels,prediction,idx,num=10):
    fig = plt.gcf()
    fig.set_size_inches(12, 14)
    if num>25: num=25
    for i in range(0, num):
        ax=plt.subplot(5,5, 1+i)
        ax.imshow(images[idx], cmap='binary')

        ax.set_title("label=" +str(labels[idx])+
                     ",predict="+str(prediction[idx])
                     ,fontsize=10)

        ax.set_xticks([]);ax.set_yticks([])
        idx+=1
    plt.show()


# In[27]:


plot_images_labels_prediction(x_Test,y_Test,prediction,idx=0)


# # confusion matrix

# In[28]:

import pandas as pd
pd.crosstab(y_Test,prediction,
            rownames=['label'],colnames=['predict'])


# In[29]:


df = pd.DataFrame({'label':y_Test, 'predict':prediction})


# In[30]:


df[(df.label==5)&(df.predict==3)]
参考文献:《TensorFlow+Keras深度学习人工智能实践应用》,林大贵