【1】
$(function () {
//加载日历列表数据
AirReport();
//加载图表数据
bindChart();
});
【2】
var dateData = [];
var dataAQI = [];
//绑定图表
function bindChart() {
$.ajax({
type: "POST",
url:"GetCityChart",
data:{start:"@ViewBag.start",end:"@ViewBag.end"},
dataType:"json",
success: function (result) {
console.info(result);
if (result.length > 0)//遍历数据
{
dateData.splice(0, dateData.length);
dataAQI.splice(0, dataAQI.length);
for (i = 0; i < result.length ; i++)
{
var tempDate = new Date(result[i].MONIDATE);
tempDate.setMinutes(0);
var dateString = tempDate.Format( 'yyyy-MM-dd')
dateData.push(dateString); //日期
dataAQI.push(result[i].AQI); //AQI
}
}
Show_AQI();
}
});
}
【3】
function Show_AQI() {
var unit = "";
myChart = echarts.init(document.getElementById("main"));
myChart.showLoading({
text: '正在努力的读取数据中...',
effect: 'bubble'
});
var option = {
color: lineColor,
title: {
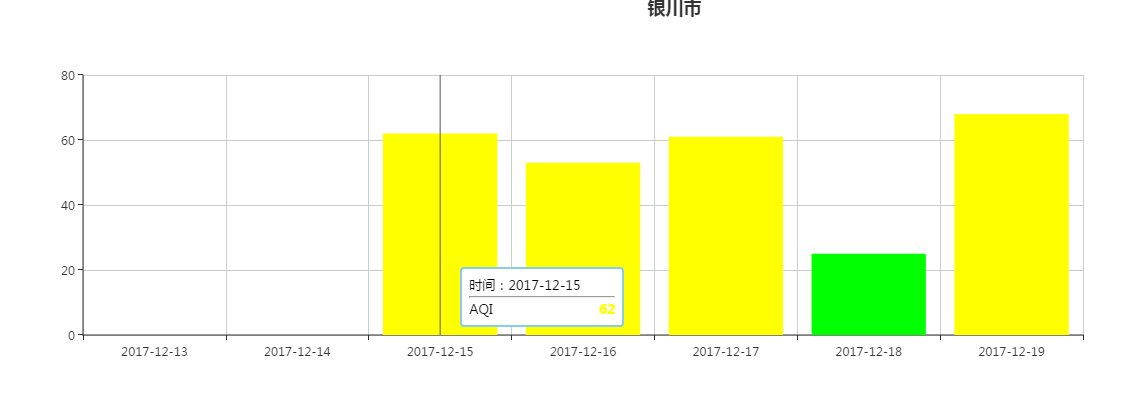
text: "银川市",
x: 'center',
padding: [0, 0, 0, 0]
},
grid: {
z: 99,
top: 80 ,
left: 80,
width: 1000,
},
tooltip: {
trigger: 'axis',
backgroundColor: 'white',
borderColor: '#87CEEB',
borderWidth: 2,
textStyle: {
fontFamily: 'Lucida Grande',
color: 'black',
fontSize: 12
},
formatter: function (obj) {
var tip = "<table width='150px' style='font-size:12px'>";
tip += "<tr><td colspan=2>" + '时间:' + obj[0].name + "</td></tr>";
tip += "<tr><td colspan='2'><hr/></td></tr>";
for (var i = 0; i < obj.length; i++) {
//tip += "<tr><td>" + obj[i].seriesName + "</td><td align='right'><font color='" + GetAQIColor(obj[i].value) + "'><b>" + obj[i].value + "</b></font></td></tr>";
tip += "<tr><td style='color:" + obj[i].color + "'>" + obj[i].seriesName + "</td><td align='right'><font color='" + GetAQIColor(obj[i].value) + "'><b>" + obj[i].value + "</b></font></td></tr>";
tip += "</table>";
return tip;
}
},
},
legend: {
padding: [40, 20, 15, 100],
data: "AQI"
},
toolbox: {
show: true,
feature: {
dataView: { show: false, readOnly: false },
restore: { show: false },
saveAsImage: { show: true }
}
},
xAxis: [
{
type: 'category',
data: dateData,
}
],
yAxis: [
{
type: 'value',
name: (unit != "") ? ("单位:" + unit) : '',
position: 'left'
}
],
series:
[{
name: 'AQI',
type: 'bar',
data:echartsColor(dataAQI)
}]
}
myChart.setOption(option);//adaptZoom(option)
myChart.hideLoading();
}
【4】
///柱状图AQI柱子颜色
function echartsColor(result)
{
var json=[];
for(var i=0;i<result.length;i++)
{
json.push({
value: (result[i] || 0),
itemStyle: {
normal: {
color: GetAQIColor(result[i] || 0)
}
}
});
}
return json;
}
【5】
/*根据AQI获取级别对应的颜色*/function GetAQIColor(aqi) {
if (aqi >= 0 && aqi <= 50)
return level1color;
else if (aqi >= 51 && aqi <= 100)
return level2color;
else if (aqi >= 101 && aqi <= 150)
return level3color;
else if (aqi >= 151 && aqi <= 200)
return level4color;
else if (aqi >= 201 && aqi < 300)
return level5color;
else if (aqi >= 300)
return level6color;
else
return "";
}